Comparable analysis, also known as “comps,” is a crucial valuation method. COMPARE.EDU.VN provides a detailed guide on how to perform this analysis effectively. Master comparable company analysis to make informed decisions; leverage tools and techniques to compare and contrast key financial metrics, enhance investment strategy, and understand market valuation.
1. What is Comparable Company Analysis?
Comparable company analysis, often referred to as “comps,” is a relative valuation technique. Unlike intrinsic valuation methods like discounted cash flow (DCF) analysis, which estimates a company’s value based on its future cash flows, comparable analysis determines value by examining the ratios and metrics of similar publicly traded companies. This method is widely used in finance to derive the value of a business by comparing it to its peers.
This valuation methodology involves analyzing key financial ratios of comparable public companies to estimate the value of a target company. It’s a relative valuation method, contrasting with intrinsic approaches like Discounted Cash Flow (DCF) analysis. Understanding how to accurately perform comparable company analysis is essential for roles in investment banking, equity research, corporate development, and private equity. This analysis helps in making informed decisions by benchmarking against industry peers and understanding market valuation.
2. Why is Comparable Company Analysis Important?
Comparable company analysis is a foundational tool in finance for several reasons:
- Valuation Benchmark: It provides a benchmark for valuation, allowing analysts to quickly assess whether a company is overvalued or undervalued relative to its peers.
- Market Insight: It offers insights into how the market values similar companies, reflecting current market sentiment and conditions.
- Decision Making: It aids in decision-making processes such as mergers and acquisitions (M&A), initial public offerings (IPOs), and investment strategies.
- Simplicity and Speed: Compared to other valuation methods, it’s relatively simple and quick to execute, making it a practical choice for initial assessments.
3. Who Uses Comparable Company Analysis?
Comps analysis is utilized by a wide range of professionals across the financial industry:
- Investment Bankers: They use it to advise companies on M&A transactions and IPOs, providing a range of potential valuations.
- Equity Research Analysts: They employ it to evaluate the fair value of stocks and make recommendations to investors.
- Corporate Development Professionals: They utilize it to assess potential acquisition targets and determine fair deal prices.
- Private Equity Investors: They use it to value potential investments and assess the financial health of portfolio companies.
4. Key Steps in Performing Comparable Company Analysis
4.1. Identify Comparable Companies
This initial step involves identifying publicly traded companies that are similar to the target company in terms of business operations, industry, size, and geographic location. This is arguably the most subjective yet critical part of the analysis.
- Industry Classification: Start by identifying the primary industry of the company you are trying to value. Use databases like Capital IQ or Bloomberg to gather detailed descriptions and industry classifications of the business.
- Screening Criteria: Run a screen in databases like Bloomberg or Capital IQ based on the following criteria:
- Industry: Ensure the companies operate in the same or closely related industries.
- Geography: Consider companies that operate in similar geographic regions.
- Size: Look for companies with comparable revenue, assets, and employee numbers.
- Growth Rate: Find companies with similar historical and projected growth rates.
- Margins and Profitability: Identify companies with comparable margins and profitability metrics.
4.2. Gather Financial Information
Once a list of comparable companies is established, the next step is to gather their financial data. This includes historical financial statements and analyst estimates.
- Data Sources: Utilize financial databases like Bloomberg Terminal or Capital IQ to efficiently import financial information directly into Excel.
- Key Metrics: The specific financial metrics needed can vary by industry and the company’s stage in its lifecycle.
- For mature businesses, focus on metrics like EBITDA (Earnings Before Interest, Taxes, Depreciation, and Amortization) and EPS (Earnings Per Share).
- For earlier-stage companies, consider metrics like Gross Profit or Revenue.
- Manual Collection: If access to premium tools like Bloomberg or Capital IQ is unavailable, financial information can be manually gathered from annual and quarterly reports.
4.3. Construct the Comps Table
The comps table is a structured spreadsheet that organizes the relevant financial information for each comparable company. It is typically set up in Excel and includes key financial data and ratios.
- Key Information:
- Company Name and Ticker: Essential for reference.
- Market Capitalization: Reflects the company’s equity value.
- Enterprise Value (EV): Represents the total value of the company.
- Revenue: Shows the company’s sales.
- EBITDA: Indicates operating profitability.
- Net Income: Represents the company’s profit after all expenses.
- Growth Rates: Historical and projected growth rates for revenue and earnings.
4.4. Calculate Relevant Ratios
With the necessary financial data gathered, calculate the key ratios that will be used for valuation. These ratios help in comparing the financial performance and valuation of the companies.
- Common Ratios:
- EV/Revenue: Measures the value of the company relative to its sales.
- EV/EBITDA: Measures the value of the company relative to its operating profit.
- P/E (Price-to-Earnings): Compares the company’s stock price to its earnings per share.
- Price-to-Book (P/B): Compares the company’s market capitalization to its book value of equity.
4.5. Apply Multiples to the Target Company
Once the ratios are calculated for the comparable companies, the next step is to apply these multiples to the target company to estimate its value.
- Calculate Averages and Medians: Find the average and median of the comparable companies’ multiples.
- Adjust for Outliers: Remove or adjust for outliers to ensure a more accurate valuation.
- Apply Multiples: Multiply the target company’s revenue, EBITDA, or net income by the average or median multiple to arrive at an estimated value.
5. Common Ratios Used in Comparable Company Analysis
5.1. EV/Revenue
- Definition: Enterprise Value to Revenue ratio.
- Use Case: Useful for valuing companies with negative earnings or those in high-growth industries.
5.2. EV/EBITDA
- Definition: Enterprise Value to Earnings Before Interest, Taxes, Depreciation, and Amortization ratio.
- Use Case: Widely used to value companies across various industries as it reflects operating profitability without the impact of financing and accounting decisions.
5.3. P/E Ratio
- Definition: Price-to-Earnings ratio.
- Use Case: Used to value mature companies with stable earnings. It indicates how much investors are willing to pay for each dollar of earnings.
5.4. Price-to-Book (P/B) Ratio
- Definition: Market capitalization to book value of equity.
- Use Case: Useful for valuing companies in industries where assets are a significant driver of value, such as banking and real estate.
6. How to Interpret the Results
Interpreting the results of comparable company analysis involves understanding the implications of the derived valuation range and considering the qualitative factors that might influence a company’s valuation.
- Identify Overvalued and Undervalued Companies: Look for companies that trade at multiples significantly higher or lower than their peers.
- Understand the “Why”: Understand the reasons behind the differences in multiples. For example, does Company A trade at a lower EV/EBITDA multiple than Company B because it is undervalued, or because it has a lower growth rate and requires more capital expenditure?
- Qualitative Factors: Consider qualitative factors such as management quality, competitive advantages, and regulatory environment, which can significantly impact a company’s valuation.
7. Best Practices for Conducting Comparable Company Analysis
To ensure the accuracy and reliability of comparable company analysis, follow these best practices:
- Use High-Quality Data: Ensure that the financial data used is accurate and up-to-date.
- Select Truly Comparable Companies: Choose companies that are as similar as possible to the target company.
- Consider Industry-Specific Metrics: Use industry-specific metrics and ratios to refine the analysis.
- Adjust for Non-Recurring Items: Adjust financial data for non-recurring items that may distort the results.
- Document Assumptions: Clearly document all assumptions and adjustments made during the analysis.
8. Common Pitfalls to Avoid
Several pitfalls can undermine the accuracy of comparable company analysis. Being aware of these can help analysts avoid making flawed conclusions.
- Using Non-Comparable Companies: Selecting companies that are not truly comparable can lead to inaccurate valuations.
- Relying Solely on Quantitative Data: Neglecting qualitative factors can result in a skewed analysis.
- Ignoring Market Conditions: Failing to account for current market conditions and sentiment can lead to misinterpretations.
- Not Adjusting for Accounting Differences: Differences in accounting practices can distort comparability if not properly adjusted.
- Over-Reliance on Historical Data: Overemphasizing historical data without considering future prospects can lead to outdated valuations.
9. Tools and Resources for Comparable Company Analysis
Several tools and resources can aid in performing comparable company analysis efficiently and accurately.
- Bloomberg Terminal: Provides comprehensive financial data, analytics, and news.
- Capital IQ: Offers detailed company information, financial data, and screening tools.
- FactSet: Provides financial data, analytics, and portfolio management tools.
- Excel: Essential for organizing data, performing calculations, and creating comps tables.
10. Real-World Applications of Comparable Company Analysis
Comparable company analysis is widely used in various financial contexts:
- Initial Public Offerings (IPOs): Valuing companies going public.
- Mergers and Acquisitions (M&A): Determining fair transaction prices.
- Equity Research: Evaluating stock prices and making recommendations.
- Fairness Opinions: Assessing the fairness of a deal price.
- Restructuring: Valuing companies undergoing financial restructuring.
- Share Buybacks: Determining appropriate buyback prices.
- Terminal Value in DCF Models: Estimating the terminal value using multiples.
10.1. Initial Public Offerings (IPOs)
Comparable company analysis is critical in determining the initial offering price for companies going public. By comparing the company to its publicly traded peers, investment bankers can establish a valuation range that reflects market sentiment and investor expectations.
10.2. Mergers and Acquisitions (M&A)
In M&A transactions, comparable company analysis helps determine a fair transaction price by benchmarking the target company against similar companies that have been acquired or are publicly traded.
10.3. Equity Research
Equity research analysts use comparable company analysis to evaluate the fair value of stocks. By comparing a company’s financial metrics and ratios to those of its peers, analysts can make buy, sell, or hold recommendations to investors.
10.4. Fairness Opinions
Fairness opinions, often required in M&A transactions, rely heavily on comparable company analysis to assess whether the terms of the deal are fair to shareholders.
10.5. Restructuring
During financial restructuring, comparable company analysis is used to value the company and its assets, helping to determine the best course of action for reorganizing the company’s finances.
10.6. Share Buybacks
Companies use comparable company analysis to determine appropriate buyback prices for their shares, ensuring that they are not overpaying and that the buyback is in the best interest of shareholders.
10.7. Terminal Value in DCF Models
In discounted cash flow (DCF) models, comparable company analysis is often used to estimate the terminal value, which represents the value of the company beyond the explicit forecast period. A common approach is to use an EV/EBITDA multiple derived from comparable companies to calculate the terminal value.
11. How to Set Up a Comps Table
Setting up a comps table involves organizing relevant financial information about the comparable companies in a structured format, typically in Excel. This allows for easy comparison and analysis of key metrics.
11.1. Organize the Table
Create a table in Excel with rows for each comparable company and columns for the relevant financial data and ratios. The table should be clearly organized with separate sections for market data, financial data, and calculated multiples.
11.2. Include Key Data Points
- Company Name and Ticker: Include the name and ticker symbol of each company for easy reference.
- Market Capitalization: Enter the current market capitalization for each company.
- Enterprise Value (EV): Calculate the enterprise value for each company using the formula: EV = Market Capitalization + Total Debt – Cash and Equivalents.
- Revenue: Include historical and projected revenue figures for each company.
- EBITDA: Include historical and projected EBITDA figures for each company.
- Net Income: Include historical and projected net income figures for each company.
11.3. Calculate Relevant Ratios
Calculate the key ratios that will be used for valuation, such as EV/Revenue, EV/EBITDA, P/E, and Price-to-Book. Ensure that these ratios are calculated consistently for all companies in the table.
11.4. Format the Table
Format the table to make it easy to read and understand. Use clear headings, consistent formatting, and color-coding to highlight key information.
- Separate Sections: Clearly separate market data, financial data, and multiples into distinct sections.
- Consistent Formatting: Use consistent formatting for numbers, dates, and text.
- Multiples Notation: Add an “x” next to multiples to clearly indicate that they are multiples (e.g., 12.5x).
- Decimal Places: Use one decimal place for multiples.
- Averages and Medians: Clearly separate the average or median section at the bottom of the table and indicate if any adjustments have been made.
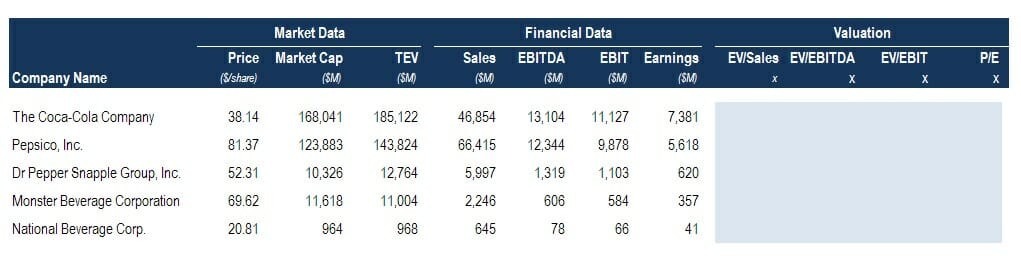 Comps Table Example
12. The Role of Multiples in Financial Modeling
Multiples play a crucial role in financial modeling, particularly in determining the terminal value in a Discounted Cash Flow (DCF) model. The terminal value represents the value of the company beyond the explicit forecast period and is a significant component of the overall valuation.
12.1. Terminal Value Assumption
Multiples are commonly used as the terminal value assumption in a DCF model. The most common approach is to use an EV/EBITDA multiple based on currently observable prices in the market.
12.2. Tying Results Back to Reality
Multiples can also be used to tie the results of the financial model back to reality. If the financial model implies a 30x EV/EBITDA multiple, and none of the comps are currently trading above 12x, the model may require some adjusting.
13. Financial Modeling Courses for Comparable Company Analysis
To enhance your skills in financial modeling and comparable company analysis, consider enrolling in one of CFI’s comprehensive financial modeling courses. These courses cover a wide range of topics, including DCF modeling, valuation techniques, and financial statement analysis.
14. Staying Updated with Market Trends
To ensure the accuracy and relevance of comparable company analysis, it is essential to stay updated with the latest market trends and industry developments.
- Read Industry Publications: Stay informed about the latest news and trends in your industry by reading industry publications, trade journals, and analyst reports.
- Monitor Market Data: Regularly monitor market data, including stock prices, trading volumes, and financial ratios, to identify any significant changes or trends.
- Attend Industry Events: Attend industry conferences, seminars, and webinars to network with other professionals and learn about new developments in the field.
- Follow Thought Leaders: Follow thought leaders and experts in your industry on social media and professional networking sites like LinkedIn to stay informed about their latest insights and analysis.
15. Frequently Asked Questions (FAQs)
15.1. What is the difference between comparable company analysis and precedent transaction analysis?
Comparable company analysis involves valuing a company based on the multiples of similar publicly traded companies. Precedent transaction analysis, on the other hand, involves valuing a company based on the prices paid for similar companies in past M&A transactions.
15.2. How do you choose the right comparable companies?
Choosing the right comparable companies involves identifying companies that are similar to the target company in terms of industry, size, geography, growth rate, and profitability. It is important to use both quantitative and qualitative factors in the selection process.
15.3. What are the limitations of comparable company analysis?
The limitations of comparable company analysis include the subjectivity in selecting comparable companies, the potential for distortions due to accounting differences, and the reliance on market data that may not accurately reflect intrinsic value.
15.4. How do you adjust for outliers in comparable company analysis?
Outliers can be adjusted by removing them from the analysis or by using statistical methods to reduce their impact, such as calculating the trimmed mean or using weighted averages.
15.5. Can comparable company analysis be used for private companies?
Yes, comparable company analysis can be used for private companies by using the multiples of publicly traded companies as a benchmark. However, it is important to adjust for differences in liquidity and risk.
15.6. What role does judgment play in comparable company analysis?
Judgment plays a significant role in comparable company analysis, particularly in selecting comparable companies, adjusting for outliers, and interpreting the results. It is important to use sound judgment and document all assumptions and adjustments made during the analysis.
15.7. How often should comparable company analysis be updated?
Comparable company analysis should be updated regularly to reflect changes in market conditions, industry trends, and company performance. It is particularly important to update the analysis before making any major investment decisions.
15.8. What are the key metrics to consider in comparable company analysis?
The key metrics to consider in comparable company analysis include EV/Revenue, EV/EBITDA, P/E, and Price-to-Book. The specific metrics used will depend on the industry and the characteristics of the companies being compared.
15.9. How does comparable company analysis help in investment decisions?
Comparable company analysis helps in investment decisions by providing a benchmark for valuation and helping to identify overvalued and undervalued companies. It can also provide insights into market sentiment and industry trends.
15.10. What are the common mistakes to avoid in comparable company analysis?
Common mistakes to avoid in comparable company analysis include using non-comparable companies, relying solely on quantitative data, ignoring market conditions, not adjusting for accounting differences, and over-reliance on historical data.
16. Enhance Your Financial Analysis Skills with COMPARE.EDU.VN
Comparable company analysis is a powerful tool for valuation and investment decision-making. By following the steps outlined in this guide and avoiding common pitfalls, you can perform effective comparable company analysis and make informed financial decisions. For more detailed comparisons and analysis, visit COMPARE.EDU.VN, your trusted source for objective and comprehensive financial insights.
Are you ready to make smarter, more informed decisions? At COMPARE.EDU.VN, we understand the challenges of comparing various options and the need for clear, unbiased information. Whether you’re evaluating investment opportunities, assessing potential acquisitions, or simply trying to understand the market, our comprehensive guides and tools are designed to help.
Visit compare.edu.vn today!
Address: 333 Comparison Plaza, Choice City, CA 90210, United States
WhatsApp: +1 (626) 555-9090
Take control of your financial future with the insights you need to succeed. Explore our resources and discover how easy it can be to make the right choice.