In the realm of chemical analysis, understanding and comparing Rf values is crucial. This guide on How To Compare Rf Values will explore this topic in detail, brought to you by COMPARE.EDU.VN. It will help students, consumers, and professionals alike to know how to compare retention factor values effectively. By the end of this guide, you’ll grasp the concept of retardation factor, the factors influencing it, and its practical uses.
1. Understanding Chromatography and Rf Values
Chromatography is a separation technique used to separate components of a mixture. It relies on the principle that different components of a mixture have different affinities for a stationary phase and a mobile phase. The Rf value, or retention factor, quantifies how far a substance travels relative to the solvent front in a chromatographic separation.
1.1. What is Chromatography?
Chromatography is a technique used to separate, identify, and purify the components of a mixture for qualitative and quantitative analysis. It works by passing a mixture dissolved in a “mobile phase” through a “stationary phase,” which separates the analyte to be measured from other molecules in the mixture based on differing physical and chemical properties between the substances of the analyte and the stationary phase.
1.2. Types of Chromatography
There are several types of chromatography, each with its own specific uses and applications:
-
Paper Chromatography: A simple technique where substances are separated on paper.
-
Thin Layer Chromatography (TLC): Similar to paper chromatography, but uses a thin layer of adsorbent material on a flat, inert substrate.
-
Column Chromatography: A method where the stationary phase is packed in a column.
-
Gas Chromatography (GC): Used to separate volatile substances.
-
High-Performance Liquid Chromatography (HPLC): A more advanced technique for separating liquid samples with high resolution.
1.3. Key Components of Chromatography
To understand how to compare Rf values, it’s important to grasp the key components of chromatography:
-
Mobile Phase: The solvent that carries the mixture through the stationary phase. It can be liquid or gas.
-
Stationary Phase: A solid or liquid that stays fixed and interacts with the components of the mixture.
-
Solute: The component to be separated.
-
Solvent Front: The farthest point reached by the mobile phase on the stationary phase.
1.4. The Concept of Rf Value
The Rf value is a ratio that compares the distance traveled by a substance to the distance traveled by the solvent front. It is calculated using the formula:
Rf = Distance traveled by the substance / Distance traveled by the solvent front
This value is always between 0 and 1, since a substance cannot travel farther than the solvent front.
2. Importance of Rf Values in Chemical Analysis
Rf values serve as a valuable tool for substance identification in chemical analysis.
2.1. Qualitative Analysis
Rf values can be used in qualitative analysis to identify the components of a mixture. By comparing the Rf values of unknown substances to those of known standards, analysts can determine the identity of the unknown substances.
2.2. Purity Assessment
Rf values can also indicate the purity of a compound. If a single spot appears on the chromatogram, it suggests that the sample is pure. Multiple spots indicate the presence of multiple components, suggesting the sample is impure.
2.3. Method Development
In method development, Rf values help optimize separation conditions. By adjusting the mobile phase composition or stationary phase, scientists can achieve better separation and more accurate results.
2.4. Forensic Science
In forensic science, Rf values can be used to identify unknown substances found at crime scenes. This can be crucial in solving criminal cases by identifying drugs, explosives, or other relevant substances.
3. Factors Influencing Rf Values
Several factors can influence Rf values, including the nature of the solute, solvent system, and stationary phase.
3.1. Nature of the Solute
The chemical properties of the solute, such as polarity and molecular size, play a significant role. Polar solutes tend to have higher affinity for polar stationary phases and vice versa.
3.2. Solvent System
The type of solvent used as the mobile phase affects the Rf value. A more polar solvent will carry polar solutes further, resulting in higher Rf values.
3.3. Stationary Phase
The composition of the stationary phase also influences Rf values. For example, silica gel is a polar stationary phase, while reversed-phase chromatography uses non-polar stationary phases.
3.4. Temperature
Temperature can affect the solubility and mobility of the solutes. Higher temperatures may increase the Rf values, but this effect is usually minimal in paper and thin-layer chromatography.
3.5. Saturation of the Chromatography Chamber
A saturated chamber ensures that the solvent evaporates evenly, leading to more reproducible Rf values.
3.6. Layer Thickness
In TLC, the thickness of the stationary phase layer can affect the Rf values. Thicker layers may result in slower migration and lower Rf values.
3.7. Adsorbent Activity
The activity of the adsorbent material can influence how strongly solutes bind to the stationary phase, affecting their Rf values.
4. How to Calculate Rf Values
Calculating Rf values is a straightforward process that involves measuring distances on the chromatogram.
4.1. Step-by-Step Guide
-
Prepare the Chromatogram: Run the chromatography experiment, ensuring that the solvent front has moved a sufficient distance.
-
Measure Distances: Measure the distance from the origin (where the sample was spotted) to the center of each spot and the distance from the origin to the solvent front.
-
Calculate Rf Values: Use the formula
Rf = Distance traveled by the substance / Distance traveled by the solvent front.
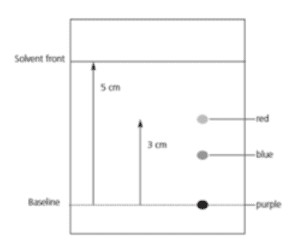
4.2. Example Calculation
Suppose a substance travels 3 cm from the origin and the solvent front travels 5 cm. The Rf value is:
Rf = 3 cm / 5 cm = 0.6
4.3. Common Mistakes to Avoid
-
Inaccurate Measurements: Ensure accurate measurement of distances.
-
Solvent Front Distortion: Use a saturated chamber to avoid uneven solvent front movement.
-
Spot Tailing: Address spot tailing by adjusting the solvent system or using a different stationary phase.
5. Techniques for Comparing Rf Values
Comparing Rf values effectively requires careful attention to detail and proper technique.
5.1. Ensuring Reproducibility
To ensure reproducibility, maintain consistent experimental conditions, including temperature, solvent composition, and stationary phase.
5.2. Standardizing Experimental Conditions
Use the same type and grade of solvents and stationary phases. Control temperature and humidity to minimize variability.
**5.3. Using Standard Reference Materials
Using standard reference materials with known Rf values can help validate your experimental setup and ensure accuracy.
5.4. Visual Comparison Techniques
Visually compare the chromatograms under the same lighting conditions. Use a ruler to accurately measure the distances traveled by the substances and the solvent front.
6. Interpreting and Analyzing Rf Values
Interpreting and analyzing Rf values correctly is crucial for drawing meaningful conclusions from chromatographic separations.
6.1. Understanding the Range of Rf Values
Rf values range from 0 to 1. A value close to 0 indicates that the substance has a strong affinity for the stationary phase, while a value close to 1 indicates a strong affinity for the mobile phase.
6.2. Comparing Rf Values of Different Compounds
When comparing Rf values, consider the chemical properties of the compounds. Polar compounds tend to have higher Rf values in polar solvents and lower Rf values in non-polar solvents.
6.3. Using Rf Values to Identify Unknown Substances
Compare the Rf values of unknown substances to those of known standards. If the Rf values match, the unknown substance is likely to be the same as the standard.
6.4. Limitations of Rf Values
Rf values can be affected by several factors, including temperature, solvent composition, and stationary phase. Therefore, it is important to control these factors to ensure accurate and reproducible results.
7. Practical Applications of Rf Values
Rf values are used in various fields for qualitative and quantitative analysis.
7.1. Pharmaceutical Analysis
In pharmaceutical analysis, Rf values are used to identify and quantify drugs and their metabolites. This is important for ensuring the quality and safety of pharmaceutical products.
7.2. Food Chemistry
In food chemistry, Rf values are used to analyze food additives, preservatives, and contaminants. This helps ensure food safety and quality.
7.3. Environmental Monitoring
In environmental monitoring, Rf values are used to detect and quantify pollutants in air, water, and soil. This is important for protecting the environment and human health.
7.4. Clinical Diagnostics
In clinical diagnostics, Rf values are used to identify and quantify biomarkers in biological samples. This can help diagnose diseases and monitor treatment effectiveness.
8. Case Studies
Examining case studies can provide a deeper understanding of how Rf values are used in real-world applications.
8.1. Identifying Dyes in Fabric
In forensic science, Rf values can be used to identify dyes in fabric samples. By comparing the Rf values of unknown dyes to those of known standards, analysts can determine the source of the fabric.
8.2. Analyzing Pigments in Art
In art conservation, Rf values can be used to analyze pigments in paintings and other artworks. This can help conservators understand the materials used by the artist and develop appropriate conservation strategies.
8.3. Detecting Pesticides in Produce
In food safety, Rf values can be used to detect pesticides in fruits and vegetables. This helps ensure that food products meet safety standards and protect consumers from harmful chemicals.
9. Advanced Techniques and Tools
Several advanced techniques and tools can enhance the accuracy and reliability of Rf value determination.
9.1. Densitometers
Densitometers are instruments that measure the optical density of spots on a chromatogram. This can provide more quantitative data than visual inspection.
9.2. Image Analysis Software
Image analysis software can be used to process chromatogram images and automatically measure the distances traveled by the substances and the solvent front.
9.3. Chromatography Data Systems (CDS)
CDS are software packages that integrate data from multiple chromatographic instruments. This can streamline data analysis and improve data management.
10. Common Challenges and Troubleshooting
Despite careful planning and execution, challenges can arise when working with Rf values.
10.1. Poor Resolution
Poor resolution can make it difficult to accurately measure the distances traveled by the substances. To improve resolution, adjust the solvent system or use a different stationary phase.
10.2. Tailing Spots
Tailing spots can distort the Rf values. To reduce tailing, add a modifier to the solvent system or use a different stationary phase.
10.3. Overlapping Spots
Overlapping spots can make it difficult to distinguish between different substances. To separate overlapping spots, adjust the solvent system or use a different stationary phase.
10.4. Streaking
Streaking can occur when the sample is overloaded. To reduce streaking, dilute the sample or use a smaller spot size.
11. The Future of Rf Value Analysis
The field of Rf value analysis is continually evolving, with new techniques and tools being developed to improve accuracy and efficiency.
11.1. Automation
Automation of chromatographic techniques can reduce human error and improve reproducibility. Automated systems can perform sample preparation, injection, separation, and detection.
11.2. Miniaturization
Miniaturization of chromatographic instruments can reduce solvent consumption and waste generation. Microfluidic devices can perform chromatographic separations on a small scale.
11.3. High-Throughput Screening
High-throughput screening techniques can be used to analyze large numbers of samples quickly and efficiently. This is important for drug discovery and other applications.
12. FAQs About Comparing Rf Values
To help you navigate the complexities of Rf values, here are some frequently asked questions:
12.1. How Can I Improve the Accuracy of My Rf Values?
Improve accuracy by standardizing experimental conditions, using high-quality solvents and stationary phases, and accurately measuring distances.
12.2. What Should I Do if My Rf Values Are Inconsistent?
If your Rf values are inconsistent, review your experimental procedure and identify any potential sources of error. Check the quality of your solvents and stationary phases, and ensure that your chromatography chamber is saturated.
12.3. Can Rf Values Be Greater Than 1?
No, Rf values cannot be greater than 1. By definition, the Rf value is the ratio of the distance traveled by the substance to the distance traveled by the solvent front. Since a substance cannot travel farther than the solvent front, the Rf value must be between 0 and 1.
12.4. How Do I Choose the Right Solvent System for My Separation?
Choose the right solvent system by considering the chemical properties of the substances you want to separate. Polar substances are best separated using polar solvents, while non-polar substances are best separated using non-polar solvents.
12.5. What Is the Significance of a High Rf Value?
A high Rf value indicates that the substance has a strong affinity for the mobile phase and is easily carried along with the solvent front.
12.6. How Do I Interpret an Rf Value of 0?
An Rf value of 0 indicates that the substance has a strong affinity for the stationary phase and does not move with the solvent front.
12.7. How Can I Use Rf Values to Identify Unknown Compounds?
Compare the Rf values of unknown compounds to those of known standards. If the Rf values match, the unknown compound is likely to be the same as the standard.
12.8. What Are the Limitations of Using Rf Values for Compound Identification?
Rf values can be affected by several factors, including temperature, solvent composition, and stationary phase. Therefore, it is important to control these factors to ensure accurate and reproducible results.
12.9. How Does Temperature Affect Rf Values?
Temperature can affect the solubility and mobility of the solutes. Higher temperatures may increase the Rf values, but this effect is usually minimal in paper and thin-layer chromatography.
12.10. What Are Some Common Applications of Rf Values in Forensic Science?
In forensic science, Rf values can be used to identify unknown substances found at crime scenes, such as drugs, explosives, and fibers.
13. Conclusion: Mastering the Art of Comparing Rf Values
Mastering the art of comparing Rf values is essential for anyone involved in chemical analysis. By understanding the principles behind chromatography, the factors that influence Rf values, and the techniques for interpreting and analyzing Rf values, you can achieve accurate and reliable results. Remember to standardize experimental conditions, use high-quality materials, and carefully measure distances to ensure the accuracy of your Rf values.
13.1. Call to Action
Are you struggling with comparing Rf values in your chemical analyses? Do you need help identifying unknown substances or optimizing your separation methods? Visit COMPARE.EDU.VN for more comprehensive guides and resources on chromatography and other analytical techniques.
At COMPARE.EDU.VN, we provide detailed comparisons and objective information to help you make informed decisions. Whether you’re a student, a consumer, or a professional, our goal is to provide you with the knowledge and tools you need to succeed.
For further assistance or inquiries, please contact us at:
- Address: 333 Comparison Plaza, Choice City, CA 90210, United States
- WhatsApp: +1 (626) 555-9090
- Website: COMPARE.EDU.VN
Let compare.edu.vn be your trusted partner in mastering the art of comparing Rf values and making informed decisions in your chemical analyses.
Understanding paper chromatography setup, emphasizing the placement of the paper, solvent, and the application of substances for accurate Rf value determination.
 Chromatogram Example
Demonstrating the calculation of Rf values using a chromatogram, showing the distance traveled by the spot and solvent to illustrate the Rf value calculation process.