Choosing the right statistical analysis to compare two groups can be confusing. COMPARE.EDU.VN offers a straightforward guide to help you select the appropriate method based on your data type and research question. Learn to confidently analyze your data, derive meaningful insights, and make informed decisions with our comprehensive comparison resources, ensuring accurate and reliable results through proper statistical testing, hypothesis evaluation, and data interpretation.
1. Introduction to Comparing Two Groups Statistically
Comparing two groups is a fundamental task in research across various disciplines, from medicine to marketing. It allows us to determine if there are significant differences between the groups, informing decisions and furthering our understanding of the phenomena being studied. Choosing the correct statistical analysis is critical for drawing valid conclusions. Selecting an inappropriate test can lead to incorrect interpretations and potentially flawed decisions. This guide from COMPARE.EDU.VN will help you navigate the complexities of statistical analysis and empower you to make informed choices for your research needs. This involves statistical significance, hypothesis testing, and data analysis.
2. Understanding Your Data: Types of Variables
Before diving into specific statistical tests, it’s crucial to understand the type of data you are working with. Data can be broadly classified into two categories: numerical (quantitative) and categorical (qualitative).
2.1 Numerical Data
Numerical data represents values that can be measured or counted. It can be further divided into:
- Continuous Data: Can take on any value within a range (e.g., height, temperature, blood pressure).
- Discrete Data: Can only take on specific, separate values (e.g., number of children, number of visits to a website).
2.2 Categorical Data
Categorical data represents qualities or characteristics. It can be further divided into:
- Nominal Data: Categories with no inherent order (e.g., eye color, type of car, gender).
- Ordinal Data: Categories with a meaningful order (e.g., education level, satisfaction rating, pain scale).
Understanding your data type is the first step in selecting the appropriate statistical test. It helps determine whether you should use parametric or non-parametric tests.
3. Defining Your Research Question
The type of research question you are asking will also influence your choice of statistical test. Common research questions when comparing two groups include:
- Is there a difference between the means of the two groups? (e.g., Do students who use method A score higher on a test than students who use method B?)
- Is there a difference in the distribution of values between the two groups? (e.g., Is there a difference in the age distribution of patients with disease X compared to healthy individuals?)
- Is there an association between a categorical variable and group membership? (e.g., Is there a relationship between smoking status and the presence of lung cancer?)
Clearly defining your research question will help you narrow down the list of potential statistical tests. Ensure your data is relevant to the question, using statistical methods to provide a valid and reliable analysis.
4. Parametric vs. Non-Parametric Tests
A crucial distinction in statistical testing is between parametric and non-parametric tests. This distinction is based on the assumptions you can make about the distribution of your data.
4.1 Parametric Tests
Parametric tests assume that your data follows a specific distribution, typically a normal distribution (also known as a Gaussian distribution). They also assume that the variances of the two groups being compared are equal (homogeneity of variance). Parametric tests are generally more powerful than non-parametric tests, meaning they are more likely to detect a significant difference if one truly exists.
Common parametric tests for comparing two groups include:
- Independent Samples t-test: Used to compare the means of two independent groups (i.e., groups where the observations in one group are not related to the observations in the other group).
- Paired Samples t-test: Used to compare the means of two related groups (i.e., groups where the observations in one group are paired with observations in the other group, such as before-and-after measurements on the same subjects).
- ANOVA (Analysis of Variance): While primarily used for comparing more than two groups, a one-way ANOVA can also be used to compare two groups.
4.2 Non-Parametric Tests
Non-parametric tests do not make assumptions about the distribution of your data. They are often used when the data is not normally distributed or when the assumptions of parametric tests are not met. Non-parametric tests are generally less powerful than parametric tests, but they are more robust to violations of assumptions.
Common non-parametric tests for comparing two groups include:
- Mann-Whitney U Test (also known as the Wilcoxon Rank-Sum Test): Used to compare the distributions of two independent groups. This test is the non-parametric equivalent of the independent samples t-test.
- Wilcoxon Signed-Rank Test: Used to compare the distributions of two related groups. This test is the non-parametric equivalent of the paired samples t-test.
- Kruskal-Wallis Test: While primarily used for comparing more than two groups, it can be adapted to compare two groups. It is a non-parametric equivalent to ANOVA.
- Chi-Square Test: Used to determine if there is a significant association between two categorical variables.
4.2.1 Choosing Between Parametric and Non-Parametric Tests
Here’s a simplified guideline:
- Normal Distribution & Equal Variances: If your data is normally distributed and the variances are equal, use a parametric test.
- Not Normally Distributed or Unequal Variances: If your data is not normally distributed or the variances are unequal, use a non-parametric test.
- Small Sample Size: With very small sample sizes, it can be difficult to assess normality. In these cases, non-parametric tests are often preferred.
Statistical assumptions play a key role in the selection process, so it’s important to verify that the assumptions are not being violated.
5. Specific Statistical Tests for Comparing Two Groups
Let’s delve into the specifics of some commonly used statistical tests.
5.1 Independent Samples t-test
The independent samples t-test is used to determine if there is a statistically significant difference between the means of two independent groups. It assumes that the data in each group is normally distributed and that the variances of the two groups are equal.
5.1.1 When to Use
- You want to compare the means of two separate and unrelated groups.
- Your data is numerical and approximately normally distributed.
- The variances of the two groups are approximately equal.
5.1.2 Example
A researcher wants to compare the effectiveness of two different teaching methods on student test scores. They randomly assign students to one of two groups: a group that receives instruction using method A and a group that receives instruction using method B. After the instruction period, all students take the same test. The researcher can use an independent samples t-test to determine if there is a significant difference in the mean test scores between the two groups.
5.1.3 Assumptions
- Independence: The observations in each group are independent of each other.
- Normality: The data in each group is approximately normally distributed.
- Homogeneity of Variance: The variances of the two groups are approximately equal.
5.1.4 How to Perform
Most statistical software packages (e.g., SPSS, R, Python) can perform an independent samples t-test. The software will calculate a t-statistic and a p-value. The p-value represents the probability of observing the obtained results (or more extreme results) if there is no true difference between the means of the two groups. If the p-value is less than a predetermined significance level (usually 0.05), the null hypothesis (that there is no difference between the means) is rejected.
5.2 Paired Samples t-test
The paired samples t-test is used to determine if there is a statistically significant difference between the means of two related groups. It is also known as the dependent samples t-test.
5.2.1 When to Use
- You want to compare the means of two related groups, such as before-and-after measurements on the same subjects.
- Your data is numerical and approximately normally distributed.
- The differences between the paired observations are approximately normally distributed.
5.2.2 Example
A researcher wants to evaluate the effectiveness of a new weight loss program. They measure the weight of each participant before starting the program and again after completing the program. The researcher can use a paired samples t-test to determine if there is a significant difference in the mean weight before and after the program.
5.2.3 Assumptions
- Independence: The pairs of observations are independent of each other.
- Normality: The differences between the paired observations are approximately normally distributed.
5.2.4 How to Perform
Similar to the independent samples t-test, most statistical software packages can perform a paired samples t-test. The software will calculate a t-statistic and a p-value. If the p-value is less than a predetermined significance level (usually 0.05), the null hypothesis (that there is no difference between the means) is rejected.
5.3 Mann-Whitney U Test
The Mann-Whitney U test is a non-parametric test used to determine if there is a statistically significant difference between the distributions of two independent groups. It is an alternative to the independent samples t-test when the data is not normally distributed or when the assumptions of the t-test are not met.
5.3.1 When to Use
- You want to compare the distributions of two separate and unrelated groups.
- Your data is not normally distributed.
- Your data is ordinal or interval but does not meet the assumptions of the t-test.
5.3.2 Example
A researcher wants to compare the satisfaction levels of customers who use two different customer service channels (e.g., phone vs. online chat). They ask customers to rate their satisfaction on a scale of 1 to 7. The researcher can use the Mann-Whitney U test to determine if there is a significant difference in the distribution of satisfaction scores between the two groups.
5.3.3 Assumptions
- Independence: The observations in each group are independent of each other.
- Ordinal or Continuous Data: The data should be measured on at least an ordinal scale.
5.3.4 How to Perform
Most statistical software packages can perform the Mann-Whitney U test. The software will calculate a U-statistic and a p-value. If the p-value is less than a predetermined significance level (usually 0.05), the null hypothesis (that there is no difference between the distributions) is rejected.
5.4 Wilcoxon Signed-Rank Test
The Wilcoxon signed-rank test is a non-parametric test used to determine if there is a statistically significant difference between the distributions of two related groups. It is an alternative to the paired samples t-test when the data is not normally distributed or when the assumptions of the t-test are not met.
5.4.1 When to Use
- You want to compare the distributions of two related groups, such as before-and-after measurements on the same subjects.
- Your data is not normally distributed.
- Your data is ordinal or interval but does not meet the assumptions of the t-test.
5.4.2 Example
A researcher wants to evaluate the effectiveness of a new medication on pain levels. They ask patients to rate their pain on a scale of 1 to 10 before taking the medication and again after taking the medication for a week. The researcher can use the Wilcoxon signed-rank test to determine if there is a significant difference in the distribution of pain scores before and after taking the medication.
5.4.3 Assumptions
- Independence: The pairs of observations are independent of each other.
- Ordinal or Continuous Data: The data should be measured on at least an ordinal scale.
- Symmetry: The distribution of the differences between the paired observations should be approximately symmetric.
5.4.4 How to Perform
Most statistical software packages can perform the Wilcoxon signed-rank test. The software will calculate a test statistic (usually denoted as W) and a p-value. If the p-value is less than a predetermined significance level (usually 0.05), the null hypothesis (that there is no difference between the distributions) is rejected.
5.5 Chi-Square Test of Independence
The chi-square test of independence is used to determine if there is a statistically significant association between two categorical variables.
5.5.1 When to Use
- You want to determine if there is a relationship between two categorical variables.
- You have data in the form of frequencies or counts for each category.
5.5.2 Example
A researcher wants to investigate whether there is a relationship between smoking status (smoker vs. non-smoker) and the presence of lung cancer (yes vs. no). They collect data from a sample of individuals and create a contingency table showing the frequencies of each combination of smoking status and lung cancer presence. The researcher can use the chi-square test of independence to determine if there is a significant association between smoking status and lung cancer.
5.5.3 Assumptions
- Independence: The observations are independent of each other.
- Expected Frequencies: The expected frequency in each cell of the contingency table should be at least 5 (some sources say at least 1). If this assumption is not met, consider using Fisher’s exact test.
5.5.4 How to Perform
Most statistical software packages can perform the chi-square test of independence. The software will calculate a chi-square statistic and a p-value. If the p-value is less than a predetermined significance level (usually 0.05), the null hypothesis (that there is no association between the variables) is rejected.
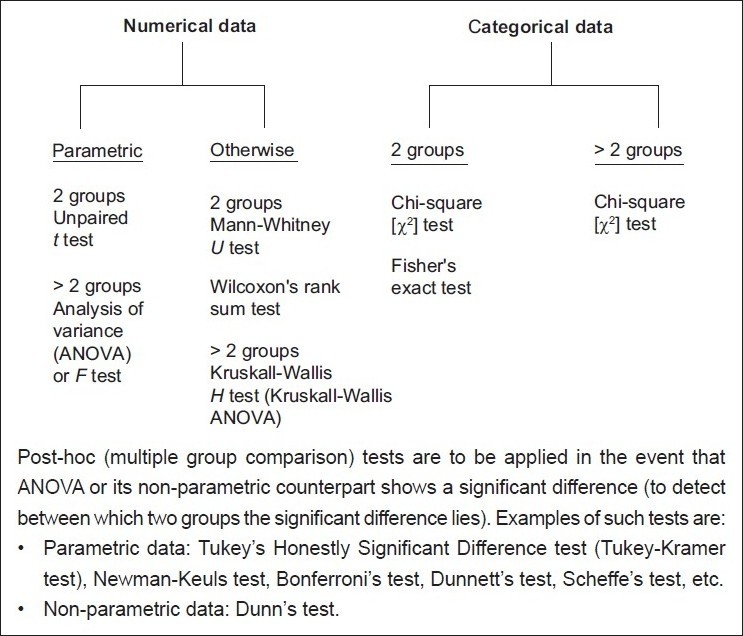
6. Flowchart for Choosing the Right Test
To further simplify the process of selecting the appropriate statistical test, consider the following flowchart:
- What type of data do you have?
- Numerical: Go to step 2.
- Categorical: Use Chi-Square Test of Independence.
- Are the two groups independent or related?
- Independent: Go to step 3.
- Related: Go to step 4.
- Is the data normally distributed and do the groups have equal variances?
- Yes: Use Independent Samples t-test.
- No: Use Mann-Whitney U Test.
- Is the data normally distributed?
- Yes: Use Paired Samples t-test.
- No: Use Wilcoxon Signed-Rank Test.
7. Beyond the Basics: Additional Considerations
While the above guidelines provide a solid foundation for choosing the right statistical test, there are some additional considerations to keep in mind.
7.1 Effect Size
In addition to statistical significance (p-value), it is important to consider the effect size. Effect size measures the magnitude of the difference between the two groups. A statistically significant result may not be practically meaningful if the effect size is small. Common measures of effect size include Cohen’s d (for t-tests) and eta-squared (for ANOVA).
7.2 Confidence Intervals
Confidence intervals provide a range of values within which the true population parameter is likely to fall. They provide more information than just a p-value and can help you assess the practical significance of your findings.
7.3 Multiple Comparisons
If you are comparing more than two groups, you need to adjust your significance level to account for the increased risk of Type I error (falsely rejecting the null hypothesis). Common methods for adjusting for multiple comparisons include the Bonferroni correction and the Holm-Bonferroni method.
7.4 Statistical Software
Familiarize yourself with statistical software packages like SPSS, R, Python, or SAS. These tools can automate the calculations and provide you with the necessary statistics and graphs to interpret your data.
8. Common Mistakes to Avoid
- Choosing a test based on convenience rather than appropriateness.
- Misinterpreting p-values. A p-value does not represent the probability that the null hypothesis is true.
- Ignoring the assumptions of the statistical tests.
- Failing to consider effect size and confidence intervals.
- Overinterpreting statistically significant results.
- Not seeking help from a statistician when needed.
9. Real-World Examples
To illustrate the application of these statistical tests, let’s consider a few real-world examples:
9.1 Example 1: Comparing the Effectiveness of Two Drugs
A pharmaceutical company is conducting a clinical trial to compare the effectiveness of two drugs (Drug A and Drug B) in treating hypertension. They randomly assign patients to one of two groups: a group that receives Drug A and a group that receives Drug B. After a month of treatment, they measure the blood pressure of each patient.
- Research Question: Is there a significant difference in the mean blood pressure reduction between the two drugs?
- Data Type: Numerical (continuous)
- Groups: Independent
- Appropriate Test: If the data is normally distributed and the variances are equal, use an independent samples t-test. Otherwise, use the Mann-Whitney U test.
9.2 Example 2: Evaluating the Impact of a Training Program
A company wants to evaluate the impact of a training program on employee productivity. They measure the productivity of each employee before the training program and again after the training program.
- Research Question: Is there a significant difference in the mean productivity before and after the training program?
- Data Type: Numerical (continuous)
- Groups: Related
- Appropriate Test: If the data is normally distributed, use a paired samples t-test. Otherwise, use the Wilcoxon signed-rank test.
9.3 Example 3: Analyzing Customer Satisfaction
A company wants to investigate whether there is a relationship between customer satisfaction (satisfied vs. dissatisfied) and product type (Type A vs. Type B). They collect data from a sample of customers and create a contingency table showing the frequencies of each combination of satisfaction and product type.
- Research Question: Is there a significant association between customer satisfaction and product type?
- Data Type: Categorical
- Appropriate Test: Chi-Square Test of Independence.
10. Conclusion: Making Informed Decisions with Statistics
Choosing the right statistical analysis to compare two groups is essential for drawing valid conclusions from your data. By understanding the type of data you are working with, defining your research question, and considering the assumptions of different statistical tests, you can select the appropriate method for your analysis. Remember to also consider effect size, confidence intervals, and the potential for multiple comparisons.
COMPARE.EDU.VN is dedicated to providing you with the resources and information you need to make informed decisions based on data. Whether you are a student, researcher, or professional, we offer comprehensive comparisons and guides to help you navigate the complexities of statistical analysis and other important topics.
Still feeling unsure about which statistical analysis to use? Visit COMPARE.EDU.VN for more detailed comparisons and resources, or contact a statistician for personalized guidance. Our goal is to empower you with the knowledge and tools you need to make confident and data-driven decisions. For assistance, you can reach us at 333 Comparison Plaza, Choice City, CA 90210, United States, or via WhatsApp at +1 (626) 555-9090. Our website is COMPARE.EDU.VN.
11. FAQs: Statistical Analysis for Comparing Two Groups
Here are some frequently asked questions about statistical analysis for comparing two groups:
-
What is the difference between a t-test and a z-test?
- A t-test is used when the population standard deviation is unknown and estimated from the sample data, while a z-test is used when the population standard deviation is known. T-tests are more commonly used in practice because the population standard deviation is often unknown.
-
What is a p-value, and how do I interpret it?
- A p-value is the probability of observing results as extreme as, or more extreme than, the results obtained, assuming the null hypothesis is true. A small p-value (typically less than 0.05) indicates strong evidence against the null hypothesis, leading to its rejection.
-
What does it mean if my data is not normally distributed?
- If your data is not normally distributed, you may need to use non-parametric statistical tests, which do not assume a specific distribution.
-
How do I check if my data is normally distributed?
- You can check for normality using visual methods such as histograms and Q-Q plots, or statistical tests such as the Shapiro-Wilk test or Kolmogorov-Smirnov test.
-
What is the difference between statistical significance and practical significance?
- Statistical significance refers to whether the results of a study are likely due to chance, while practical significance refers to whether the results are meaningful and useful in the real world. A result can be statistically significant but not practically significant if the effect size is small.
-
When should I use a one-tailed test versus a two-tailed test?
- Use a one-tailed test when you have a specific directional hypothesis (e.g., you expect group A to be greater than group B). Use a two-tailed test when you do not have a specific directional hypothesis (e.g., you want to know if there is any difference between group A and group B).
-
What is effect size, and why is it important?
- Effect size measures the magnitude of the difference between groups. It is important because it provides information about the practical significance of the findings, regardless of the sample size.
-
How do I handle outliers in my data?
- Outliers can be handled in several ways, including removing them (if justified), transforming the data, or using robust statistical methods that are less sensitive to outliers.
-
What if my sample size is very small?
- With small sample sizes, it is more difficult to detect statistically significant differences. Non-parametric tests are often preferred in these cases, and it is important to interpret the results with caution.
-
Where can I find more help with statistical analysis?
- You can find more help with statistical analysis at compare.edu.vn, through statistical textbooks, online courses, or by consulting with a statistician.