India is on the verge of becoming the world’s most populous nation, surpassing China and marking a significant demographic shift on the global stage. While population size is a critical aspect of a nation’s profile, understanding the overall “size” of a country involves considering various factors, including geographical area, demographic distribution, and more. This article delves into a detailed comparison of India and the United States, two of the world’s most influential countries, examining different dimensions of their size and scale.
India’s population growth has been remarkable, adding over a billion people since 1950. Current estimates place its population at over 1.4 billion, exceeding the entire population of Europe or the Americas. While China also boasts a population exceeding 1.4 billion, it is now experiencing population decline, whereas India’s population continues to expand.
The United Nations projects that India’s population will surpass 1.5 billion by the end of this decade and reach a peak of 1.7 billion around 2064 before potentially stabilizing. This contrasts sharply with the United States, which, while the third most populous country globally, has a significantly smaller population of around 330 million.
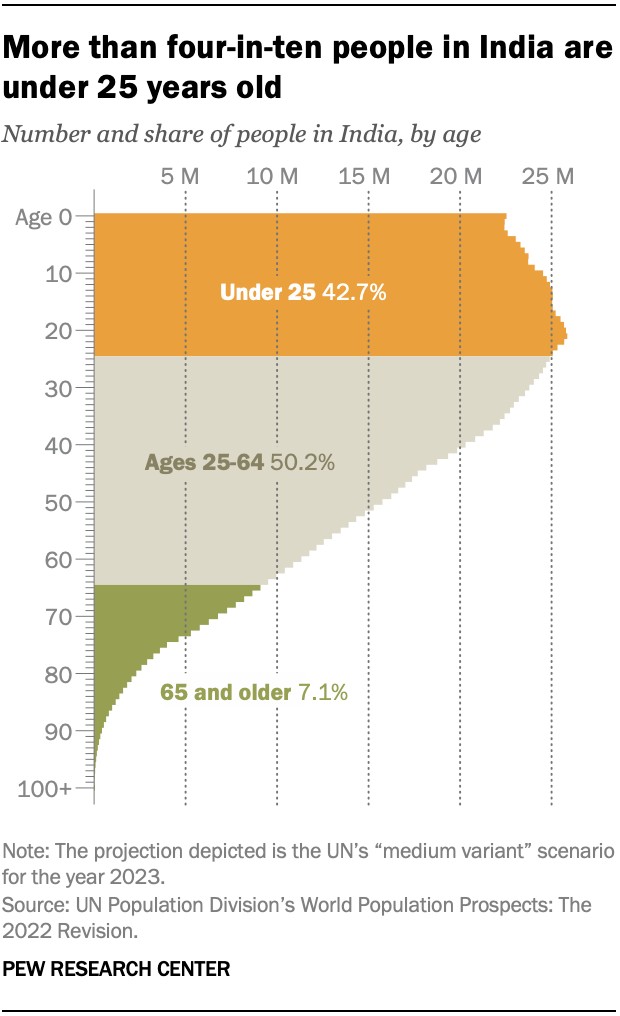
One key difference in the demographic “size” of India and the United States lies in their age distribution. India boasts a youthful population, with over 40% under the age of 25. In fact, approximately one in five people globally under 25 reside in India. The median age in India is a youthful 28 years.
In contrast, the United States has a considerably older population, with a median age of 38. While a younger population can be a demographic dividend, offering a large workforce, it also presents challenges in terms of education, employment, and resource allocation. The aging population of the United States, while facing different sets of challenges related to healthcare and social security, reflects a different stage in demographic transition.
Another critical aspect of size comparison is fertility rates. While fertility rates have declined significantly in India in recent decades, the average Indian woman is expected to have 2.0 children in her lifetime. This is higher than both China (1.2) and the United States (1.6). The rapid decline in India’s fertility rate across all religious groups is a notable trend, yet it remains a factor contributing to its continued population growth, unlike the below-replacement fertility rates in the US and China.
Geographically, the “size” comparison reveals further contrasts. The United States covers a significantly larger land area than India. The US encompasses approximately 9.8 million square kilometers, making it the fourth-largest country by landmass. India, while geographically substantial, is considerably smaller, covering around 3.3 million square kilometers, ranking as the seventh-largest country.
This difference in land area is crucial when considering population density. With a much larger population concentrated in a smaller land area, India has a significantly higher population density than the United States. This density impacts resource management, infrastructure development, and urbanization patterns in distinct ways in both countries.
Fertility rates within India also exhibit regional variations, further highlighting the diverse demographic landscape within the country. Rural areas in India have a higher fertility rate (2.1 children per woman) compared to urban areas (1.6 children per woman). These figures were significantly higher just two decades ago, indicating a nationwide trend of declining fertility.
State-level data reveals even more pronounced variations, with total fertility rates ranging from nearly 3 children per woman in states like Bihar and Meghalaya to around 1 child per woman in Sikkim and Goa. These disparities are linked to various socio-economic factors, including access to education, healthcare, and economic opportunities, which shape demographic trends across different regions of India.
Population growth rates also vary significantly across Indian states. Between 2001 and 2011, some states like Meghalaya and Arunachal Pradesh experienced population increases of 25% or more, while others, such as Goa and Kerala, saw growth rates below 10%. Nagaland even experienced a slight population decrease. These regional differences are often attributed to uneven economic development and variations in quality of life, leading to internal migration patterns and diverse demographic trajectories across India.
Another aspect of demographic comparison is the age at which women have their first child. In urban India, women tend to have their first child about 1.5 years later than women in rural areas. Factors such as education and wealth also play a role, with more educated and wealthier women tending to delay childbirth. These trends reflect societal shifts and evolving choices regarding family planning and career aspirations.
India has also historically faced an imbalanced sex ratio at birth, with more boys born than girls. This issue, linked to prenatal sex-selective practices, has been gradually narrowing. While the sex ratio was skewed at 111 boys per 100 girls in the 2011 census, recent data indicates a slight normalization, reaching approximately 108 boys per 100 girls. This positive trend suggests a shift in societal attitudes and stricter enforcement of regulations against sex-selective abortions.
Infant mortality rates, while dramatically reduced in India over the past three decades (a 70% decrease), still remain higher than in many other countries, including the United States. In 2020, India’s infant mortality rate was 27 deaths per 1,000 live births. While a significant improvement from 89 deaths per 1,000 live births in 1990, it is still higher than rates in neighboring countries like Bangladesh and Nepal, and substantially higher than the rates in China and the United States (both at 6 and 5 deaths per 1,000 live births, respectively).
Migration patterns also differ significantly between India and the United States. India typically experiences net negative migration, meaning more people emigrate out of India than immigrate into it. In 2021, India’s net migration resulted in a loss of approximately 300,000 people. This contrasts with the United States, which has historically been a major destination for immigrants, although immigration patterns and policies are subject to change.
In conclusion, comparing the “size” of India and the United States reveals a multifaceted picture. While India is poised to become the world’s most populous country, its geographical size is considerably smaller than the United States. India’s youthful demographic profile contrasts with the aging population of the US. Both countries exhibit declining fertility rates, but India’s remains slightly higher. Understanding these diverse dimensions of “size” is crucial for comprehending the distinct challenges and opportunities facing these two global powers in the 21st century.