Comparable company analysis, also known as trading comps, is a powerful tool for understanding a company’s value relative to its peers. By comparing a target company’s financial metrics and ratios to those of similar publicly traded companies, investors and analysts can arrive at a benchmark valuation. COMPARE.EDU.VN provides comprehensive comparisons to help you make informed decisions. This method offers insights into market sentiment and industry trends, aiding in strategic investment decisions. It involves comparative analysis, market valuation, and relative valuation techniques.
1. Understanding the Essence of Popular Comparable Company Analysis
Comparable company analysis (CCA) stands as a cornerstone of valuation methodologies, particularly in finance and investment banking. It operates on the fundamental premise that similar companies will exhibit comparable valuation metrics. The key to this method lies in identifying and analyzing “Popular Comparable Companies”—those that share key characteristics with the company being valued. This includes their industry, size, growth rate, profitability, and risk profile.
1.1 The Core Principle: Relative Valuation
At its core, CCA is a relative valuation technique. Unlike absolute valuation methods, such as discounted cash flow (DCF) analysis, which attempt to determine a company’s intrinsic value based on its future cash flows, CCA focuses on how the market is currently valuing similar companies. This approach offers a real-time, market-driven perspective on valuation.
**1.2 Identifying Key Comparables
The first and arguably most crucial step in CCA is selecting the peer group. This involves identifying companies that are truly comparable to the target company. Factors to consider include:
- Industry: Companies should operate in the same or closely related industries.
- Business Model: Similar revenue streams, product/service offerings, and customer base.
- Size: Comparable market capitalization or revenue.
- Growth Rate: Similar historical and projected growth rates.
- Profitability: Comparable margins (e.g., gross margin, operating margin).
- Risk Profile: Similar financial leverage and operational risks.
The more closely aligned the peer group is to the target company, the more reliable the valuation will be.
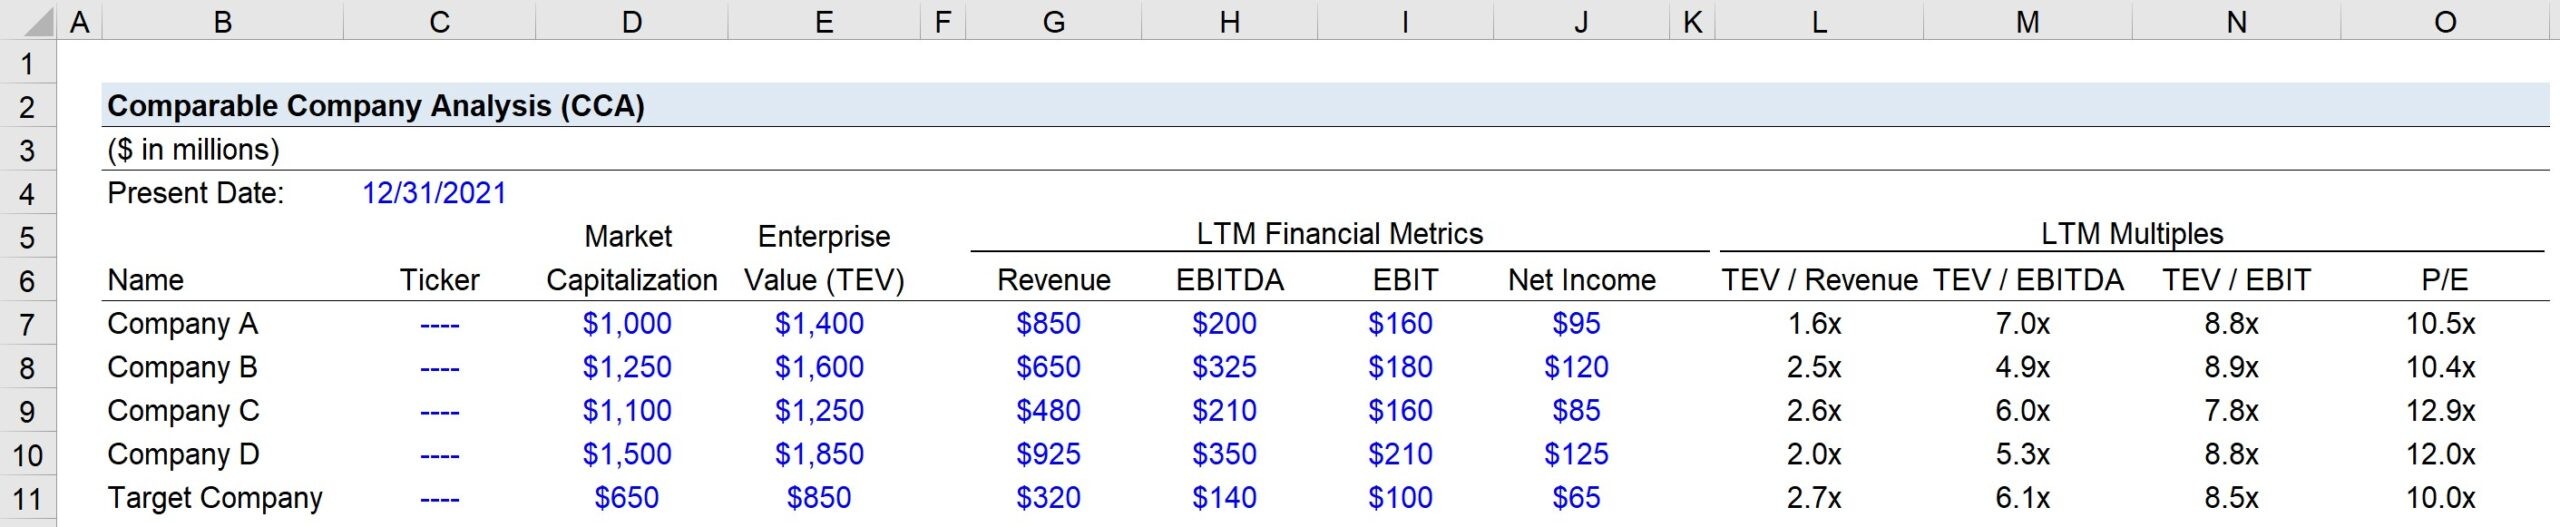
1.3 Calculating Valuation Multiples
Once the peer group is established, the next step is to calculate relevant valuation multiples. These multiples serve as a standardized metric for comparing the target company to its peers. Common multiples include:
- Price-to-Earnings (P/E) Ratio: Market capitalization divided by net income.
- Enterprise Value-to-EBITDA (EV/EBITDA): Enterprise value divided by earnings before interest, taxes, depreciation, and amortization.
- Price-to-Sales (P/S) Ratio: Market capitalization divided by revenue.
- Price-to-Book (P/B) Ratio: Market capitalization divided by book value of equity.
Each multiple provides a different perspective on valuation. P/E ratios reflect investor expectations for future earnings, while EV/EBITDA is often used to value companies with significant debt.
1.4 Applying Multiples to the Target Company
After calculating the multiples for the peer group, the median or average multiple is then applied to the corresponding financial metric of the target company. This yields an implied valuation range for the target. For example, if the median EV/EBITDA multiple of the peer group is 10x, and the target company’s EBITDA is $100 million, the implied enterprise value would be $1 billion.
1.5 Refining the Valuation
The initial valuation derived from CCA is a starting point. It’s crucial to consider qualitative factors that may differentiate the target company from its peers. These factors might include:
- Management Quality: A superior management team may warrant a higher valuation.
- Brand Strength: A strong brand can command a premium.
- Competitive Advantages: Proprietary technology, patents, or a dominant market share.
- Regulatory Environment: Favorable or unfavorable regulations.
Adjusting the valuation to account for these qualitative factors can lead to a more accurate assessment.
2. The Mechanics of Conducting Comparable Company Analysis
To effectively utilize comparable company analysis (CCA), a structured approach is essential. This section outlines the step-by-step process, ensuring a comprehensive and reliable valuation.
2.1 Step 1: Defining the Scope
The initial step involves clearly defining the scope of the analysis. This includes:
- Identifying the Target Company: Clearly define the company you are trying to value.
- Determining the Purpose of the Valuation: Are you valuing the company for a potential acquisition, investment, or internal strategic planning?
- Establishing the Valuation Date: The date for which the valuation is being performed.
A well-defined scope ensures that the analysis remains focused and relevant.
2.2 Step 2: Identifying Popular Comparable Companies
Identifying genuinely comparable companies is the most critical and challenging aspect of CCA. This involves a rigorous screening process, considering both quantitative and qualitative factors.
- Quantitative Screening:
- Industry Classification: Use standard industry classification codes (e.g., SIC, NAICS) to identify companies in the same industry.
- Financial Metrics: Screen for companies with similar revenue, growth rates, and profitability margins.
- Market Capitalization: Filter for companies with comparable market capitalization.
- Qualitative Screening:
- Business Model Analysis: Analyze the business models of potential comparables, focusing on revenue streams, customer base, and product/service offerings.
- Competitive Landscape: Assess the competitive dynamics of the industry and identify companies that compete directly with the target.
- Geographic Considerations: Consider geographic similarities, especially for companies with a strong regional focus.
It’s important to cast a wide net initially and then refine the peer group based on a deeper analysis of each company.
2.3 Step 3: Gathering Financial Data
Once the peer group is established, the next step is to gather the necessary financial data. This typically involves collecting:
- Historical Financial Statements: Income statements, balance sheets, and cash flow statements for the past 3-5 years.
- Analyst Reports: Research reports from investment banks and other financial institutions.
- Company Filings: 10-K, 10-Q, and other filings with regulatory agencies.
- Market Data: Stock prices, market capitalization, and trading volumes.
Reliable data sources are crucial for accurate analysis. Common sources include:
- SEC Edgar Database: For company filings.
- Bloomberg, Reuters, FactSet: For comprehensive financial data and analyst reports.
- Company Investor Relations Websites: For investor presentations and press releases.
2.4 Step 4: Calculating Valuation Multiples
With the financial data in hand, the next step is to calculate the relevant valuation multiples for each company in the peer group. This involves:
- Standardizing Financial Data: Ensure that financial data is standardized across all companies, adjusting for any accounting differences or non-recurring items.
- Calculating Key Multiples: Calculate the P/E ratio, EV/EBITDA, P/S ratio, and other relevant multiples.
- Analyzing Multiple Ranges: Determine the minimum, maximum, median, and average multiples for the peer group.
It’s important to use consistent definitions and calculations for all multiples to ensure comparability.
2.5 Step 5: Applying Multiples to the Target Company
The final step involves applying the multiples derived from the peer group to the corresponding financial metrics of the target company. This yields an implied valuation range for the target.
- Selecting the Appropriate Multiple: Choose the multiple that is most relevant to the target company’s industry and business model.
- Applying the Median or Average: Use the median or average multiple from the peer group to calculate the implied valuation.
- Considering Qualitative Factors: Adjust the valuation to account for any qualitative factors that may differentiate the target company from its peers.
The resulting valuation range provides a useful benchmark for assessing the target company’s value.
3. Advantages and Disadvantages of Comparable Company Analysis
Like any valuation method, comparable company analysis (CCA) has its strengths and weaknesses. Understanding these advantages and disadvantages is essential for using CCA effectively.
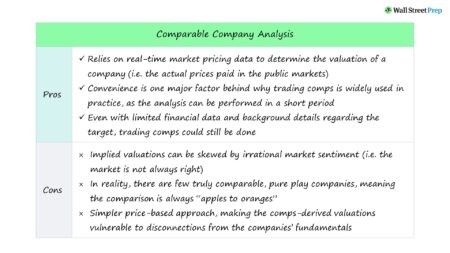
3.1 Advantages of CCA
- Market-Driven: CCA reflects the current market sentiment and valuation trends, providing a real-time perspective on valuation.
- Relatively Simple: Compared to more complex methods like DCF analysis, CCA is relatively straightforward and easy to implement.
- Objective: CCA relies on objective market data, reducing the subjectivity inherent in other valuation approaches.
- Useful for Benchmarking: CCA provides a useful benchmark for assessing a company’s value relative to its peers.
- Widely Accepted: CCA is a widely accepted and commonly used valuation method in the finance industry.
3.2 Disadvantages of CCA
- Dependence on Comparables: The accuracy of CCA depends heavily on the availability of truly comparable companies.
- Market Distortions: Market inefficiencies and irrational investor behavior can distort valuations, leading to inaccurate results.
- Lack of Forward-Looking Perspective: CCA relies on historical data and current market conditions, lacking a forward-looking perspective.
- Ignores Intrinsic Value: CCA focuses on relative valuation, ignoring the intrinsic value of the company based on its future cash flows.
- Simplistic Approach: CCA can oversimplify valuation, failing to capture the nuances of a company’s business model and competitive position.
3.3 Mitigating the Disadvantages
While CCA has its limitations, there are ways to mitigate these disadvantages:
- Careful Peer Group Selection: Rigorously screen potential comparables to ensure they are truly similar to the target company.
- Adjusting for Differences: Adjust the valuation to account for any qualitative factors that differentiate the target company from its peers.
- Using Multiple Valuation Methods: Use CCA in conjunction with other valuation methods, such as DCF analysis, to provide a more comprehensive assessment.
- Considering Market Conditions: Take into account current market conditions and valuation trends when interpreting the results of CCA.
- Sensitivity Analysis: Perform sensitivity analysis to assess the impact of different assumptions on the valuation.
By understanding the advantages and disadvantages of CCA and taking steps to mitigate its limitations, you can use this method effectively to inform your investment decisions.
4. Key Considerations When Selecting Popular Comparable Companies
The selection of popular comparable companies is the linchpin of an accurate and reliable comparable company analysis (CCA). This process demands meticulous attention to detail and a thorough understanding of the target company’s business model, industry dynamics, and financial profile.
4.1 Industry Alignment
The cornerstone of peer group selection is ensuring that the comparable companies operate within the same or closely related industry as the target company. This is because companies in the same industry typically share similar:
- Business Models: Revenue streams, cost structures, and operational characteristics.
- Growth Drivers: Industry trends, market opportunities, and competitive forces.
- Risk Factors: Regulatory environment, technological disruptions, and economic cycles.
To identify companies in the same industry, utilize standard industry classification codes, such as the Standard Industrial Classification (SIC) or the North American Industry Classification System (NAICS). However, exercise caution when relying solely on these codes, as they may not always capture the nuances of a company’s business activities.
4.2 Business Model Similarity
Beyond industry alignment, it’s crucial to assess the similarity of the business models of potential comparables. This involves analyzing:
- Revenue Streams: How the company generates revenue (e.g., product sales, service fees, subscriptions).
- Customer Base: The target market and customer demographics.
- Product/Service Offerings: The types of products or services offered and their competitive positioning.
- Value Chain: The activities involved in creating and delivering value to customers.
Companies with similar business models are more likely to exhibit comparable valuation multiples.
4.3 Financial Profile Comparability
The financial profile of comparable companies should also be similar to that of the target company. Key financial metrics to consider include:
- Revenue Size: Companies with comparable revenue size are likely to face similar operational challenges and opportunities.
- Growth Rate: Companies with similar growth rates are likely to be valued similarly by the market.
- Profitability Margins: Companies with comparable profitability margins (e.g., gross margin, operating margin, net margin) are likely to have similar cost structures and competitive advantages.
- Capital Structure: Companies with similar levels of debt and equity financing are likely to have comparable risk profiles.
When comparing financial metrics, it’s important to consider both historical performance and future expectations.
4.4 Market Capitalization Alignment
Market capitalization, which is the total value of a company’s outstanding shares, is another important factor to consider when selecting comparable companies. Companies with similar market capitalizations are likely to be subject to similar investor sentiment and market dynamics.
However, it’s important to note that market capitalization can be influenced by factors other than a company’s fundamental performance, such as market trends and investor speculation.
4.5 Geographic Considerations
For companies with a strong regional focus, geographic considerations are also important. Companies operating in the same geographic region are likely to be subject to similar economic conditions, regulatory environments, and cultural influences.
However, globalization has made geographic boundaries less relevant for some industries, particularly those with a strong online presence.
5. Common Mistakes to Avoid in Comparable Company Analysis
Comparable company analysis (CCA) is a valuable tool, but its effectiveness hinges on avoiding common pitfalls. Recognizing and mitigating these mistakes can significantly enhance the accuracy and reliability of your valuation.
5.1 Neglecting Qualitative Factors
One of the most common mistakes in CCA is focusing solely on quantitative data while neglecting qualitative factors. While financial metrics are important, they don’t tell the whole story. Qualitative factors, such as management quality, brand strength, and competitive advantages, can significantly impact a company’s valuation.
- Management Quality: A strong and experienced management team can drive growth and profitability.
- Brand Strength: A well-known and respected brand can command a premium in the market.
- Competitive Advantages: Proprietary technology, patents, or a dominant market share can create a sustainable competitive advantage.
Failing to consider these qualitative factors can lead to an inaccurate valuation.
5.2 Ignoring Non-Recurring Items
Non-recurring items, such as one-time gains or losses, can distort a company’s financial performance and lead to misleading valuation multiples. It’s important to identify and adjust for these items when calculating valuation multiples.
- One-Time Gains: Proceeds from the sale of assets or investments.
- One-Time Losses: Impairment charges, restructuring costs, or litigation settlements.
By excluding non-recurring items, you can get a clearer picture of a company’s underlying financial performance.
5.3 Using Stale Data
Using stale or outdated data can also lead to inaccurate valuations. Financial data and market conditions can change rapidly, so it’s important to use the most up-to-date information available.
- Financial Statements: Use the most recent financial statements available.
- Market Data: Use current stock prices and market capitalization data.
- Analyst Reports: Consult recent analyst reports for updated insights and projections.
Using stale data can result in a valuation that is no longer relevant or reliable.
5.4 Applying Inappropriate Multiples
Applying inappropriate valuation multiples can also lead to inaccurate results. Different multiples are more appropriate for different industries and business models.
- P/E Ratio: Suitable for companies with stable earnings and a clear growth trajectory.
- EV/EBITDA: Useful for valuing companies with significant debt or capital expenditures.
- P/S Ratio: Appropriate for companies with high growth potential but limited earnings.
Using the wrong multiple can result in a valuation that is not reflective of the company’s true value.
5.5 Failing to Consider Market Conditions
Market conditions can significantly impact valuation multiples. During periods of economic expansion, multiples tend to be higher, while during periods of economic contraction, multiples tend to be lower.
- Economic Growth: Strong economic growth can boost investor confidence and drive up multiples.
- Interest Rates: Low interest rates can make stocks more attractive relative to bonds, leading to higher multiples.
- Market Volatility: High market volatility can increase investor risk aversion and depress multiples.
Failing to consider market conditions can lead to a valuation that is out of sync with the current market environment.
6. Advanced Techniques to Refine Your Analysis
While the basic principles of comparable company analysis (CCA) are relatively straightforward, there are several advanced techniques that can be used to refine your analysis and improve its accuracy.
6.1 Regression Analysis
Regression analysis is a statistical technique that can be used to identify the key drivers of valuation multiples. By analyzing the relationship between valuation multiples and various financial and operational metrics, you can develop a more sophisticated understanding of how the market values companies in a particular industry.
- Independent Variables: Financial metrics, such as revenue growth, profitability margins, and capital structure.
- Dependent Variable: Valuation multiple, such as P/E ratio or EV/EBITDA.
Regression analysis can help you identify the factors that have the greatest impact on valuation multiples and develop a more accurate valuation model.
6.2 Discount for Lack of Marketability (DLOM)
The Discount for Lack of Marketability (DLOM) is a reduction in value applied to private companies to reflect the fact that their shares are not as easily bought and sold as those of publicly traded companies. The DLOM can be estimated using a variety of methods, including:
- Restricted Stock Studies: Analyzing the discounts at which restricted stock (shares that cannot be sold for a certain period of time) trade relative to freely traded shares.
- Pre-IPO Studies: Examining the discounts at which private companies are valued prior to going public.
- Option Pricing Models: Using option pricing models to estimate the cost of illiquidity.
Applying a DLOM can result in a more realistic valuation for private companies.
6.3 Control Premium
The control premium is an additional amount that a buyer is willing to pay for a controlling interest in a company. The control premium reflects the value of being able to make strategic decisions about the company’s operations and direction.
The control premium can be estimated by analyzing past transactions in which controlling interests were acquired.
Adding a control premium can result in a higher valuation for companies that are likely to be acquired.
6.4 Sensitivity Analysis
Sensitivity analysis involves assessing the impact of different assumptions on the valuation. By varying key assumptions, such as revenue growth, profitability margins, and discount rates, you can develop a range of possible valuations and understand the potential downside and upside risks.
Sensitivity analysis can help you make more informed investment decisions by providing a more complete picture of the potential outcomes.
6.5 Scenario Analysis
Scenario analysis involves developing different scenarios for the future and estimating the valuation under each scenario. This can be particularly useful for companies that are subject to significant uncertainty or volatility.
- Best-Case Scenario: Optimistic assumptions about future growth and profitability.
- Worst-Case Scenario: Pessimistic assumptions about future growth and profitability.
- Base-Case Scenario: Most likely assumptions about future growth and profitability.
Scenario analysis can help you understand the potential range of outcomes and make more informed investment decisions.
7. Real-World Examples of Popular Comparable Company Analysis
To illustrate the practical application of comparable company analysis (CCA), let’s examine a few real-world examples across different industries.
7.1 Technology Industry: Valuing a Software Company
Consider a hypothetical software company, “TechSoft,” that develops and sells enterprise resource planning (ERP) software. To value TechSoft using CCA, an analyst would first identify a peer group of publicly traded software companies with similar business models, revenue size, and growth rates.
- Peer Group:
- Salesforce (CRM)
- SAP (SAP)
- Oracle (ORCL)
- Workday (WDAY)
The analyst would then gather financial data for these companies and calculate key valuation multiples, such as P/E ratio, EV/EBITDA, and P/S ratio.
| Company | P/E | EV/EBITDA | P/S |
|---|---|---|---|
| Salesforce | 50x | 30x | 10x |
| SAP | 25x | 15x | 5x |
| Oracle | 20x | 12x | 4x |
| Workday | 60x | 35x | 12x |
| Median | 37.5x | 22.5x | 7.5x |
Assuming TechSoft has an EPS of $2.00, EBITDA of $50 million, and revenue of $200 million, the analyst would apply the median multiples to estimate TechSoft’s valuation.
- P/E Valuation: 37.5x * $2.00 = $75 per share
- EV/EBITDA Valuation: 22.5x * $50 million = $1,125 million (Enterprise Value)
- P/S Valuation: 7.5x * $200 million = $1,500 million (Market Capitalization)
The analyst would then consider qualitative factors, such as TechSoft’s management team and competitive advantages, to refine the valuation.
7.2 Retail Industry: Valuing a Apparel Company
Let’s consider a scenario involving valuing an apparel company using comparable company analysis (CCA). Suppose we are tasked with valuing “FashionForward,” a mid-sized apparel retailer specializing in trendy clothing for young adults.
Step 1: Identify Popular Comparable Companies
The first step is to identify a peer group of publicly traded apparel retailers that are similar to FashionForward in terms of business model, target market, and revenue size.
- Peer Group:
- Abercrombie & Fitch (ANF)
- American Eagle Outfitters (AEO)
- Gap (GPS)
- Urban Outfitters (URBN)
Step 2: Gather Financial Data
Next, we gather financial data for each company in the peer group, including historical financial statements and market data. This data can be obtained from sources such as SEC filings, Bloomberg, and Yahoo Finance.
Step 3: Calculate Valuation Multiples
Using the financial data, we calculate key valuation multiples for each company in the peer group, such as Price-to-Earnings (P/E) ratio, Enterprise Value-to-EBITDA (EV/EBITDA), and Price-to-Sales (P/S) ratio.
| Company | P/E | EV/EBITDA | P/S |
|---|---|---|---|
| Abercrombie & Fitch (ANF) | 20x | 10x | 1.0x |
| American Eagle (AEO) | 18x | 9x | 0.9x |
| Gap (GPS) | 15x | 7x | 0.7x |
| Urban Outfitters (URBN) | 22x | 11x | 1.1x |
| Median | 19x | 9.5x | 0.95x |
Step 4: Apply Multiples to the Target Company
We then apply the median multiples from the peer group to FashionForward’s financial metrics to estimate its valuation.
- FashionForward’s Latest Financials:
- Earnings per Share (EPS): $1.50
- EBITDA: $50 million
- Sales: $200 million
Applying the median multiples:
- P/E Valuation: 19x * $1.50 = $28.50 per share
- EV/EBITDA Valuation: 9.5x * $50 million = $475 million (Enterprise Value)
- P/S Valuation: 0.95x * $200 million = $190 million (Market Capitalization)
Step 5: Consider Qualitative Factors
Finally, we consider any qualitative factors that may impact FashionForward’s valuation, such as its brand reputation, management team, and competitive landscape. We may adjust the valuation range based on these factors.
Conclusion
Based on the comparable company analysis, we estimate that FashionForward’s stock is around $28.50 per share or $190 to $475 million valuation. However, it’s important to note that this is just an estimate, and the actual value of the company may be different.
8. Utilizing COMPARE.EDU.VN for Enhanced Analysis
In today’s fast-paced business environment, making informed decisions quickly is crucial. COMPARE.EDU.VN is designed to help you do just that by providing comprehensive and easily digestible comparative analyses.
8.1 Streamlined Comparison Process
COMPARE.EDU.VN simplifies the process of comparing different companies, products, or services. Our platform offers a user-friendly interface that allows you to quickly identify key similarities and differences between various options. This streamlined approach saves you time and effort, enabling you to focus on making strategic decisions.
8.2 Comprehensive Data Analysis
Our team of experts meticulously gathers and analyzes data from a wide range of sources to provide you with the most accurate and up-to-date information. We go beyond surface-level comparisons, delving into the details to uncover valuable insights that can inform your decision-making process.
8.3 Objective and Unbiased Information
At COMPARE.EDU.VN, we are committed to providing objective and unbiased information. We do not accept payments or incentives from companies to promote their products or services. This ensures that our comparisons are fair and impartial, allowing you to make decisions based on facts, not opinions.
8.4 Customizable Comparison Criteria
We understand that every decision is unique, and the criteria that are important to you may differ from those of others. That’s why COMPARE.EDU.VN allows you to customize the comparison criteria to focus on the factors that matter most to you. This level of customization ensures that you get the information you need to make the best possible decision.
8.5 Real-Time Updates
The business world is constantly evolving, and new information is always emerging. COMPARE.EDU.VN is continuously updated with the latest data and insights to ensure that you have access to the most current information available. This real-time updating helps you stay ahead of the curve and make decisions based on the most relevant information.
By utilizing COMPARE.EDU.VN, you can enhance your analysis and make more informed decisions with confidence. Whether you’re comparing investment opportunities, evaluating product options, or assessing service providers, our platform provides the tools and resources you need to succeed.
9. Conclusion: Making Informed Decisions with Popular Comparable Company Analysis
Comparable company analysis (CCA) is a powerful valuation tool that can provide valuable insights into a company’s worth relative to its peers. By understanding the principles and techniques of CCA, avoiding common mistakes, and utilizing advanced methods, you can refine your analysis and make more informed investment decisions.
9.1 Key Takeaways
- Comparable company analysis (CCA) is a relative valuation method that values a company based on the market prices of similar companies.
- The key steps in CCA include identifying comparable companies, gathering financial data, calculating valuation multiples, and applying those multiples to the target company.
- Common valuation multiples include Price-to-Earnings (P/E) ratio, Enterprise Value-to-EBITDA (EV/EBITDA), and Price-to-Sales (P/S) ratio.
- The selection of popular comparable companies is crucial for accurate analysis.
- Common mistakes to avoid in CCA include neglecting qualitative factors, ignoring non-recurring items, using stale data, applying inappropriate multiples, and failing to consider market conditions.
- Advanced techniques to refine your analysis include regression analysis, discount for lack of marketability (DLOM), control premium, sensitivity analysis, and scenario analysis.
9.2 The Importance of Continuous Learning
The world of finance is constantly evolving, and it’s important to stay up-to-date with the latest trends and techniques. Continuous learning is essential for anyone who wants to succeed in the field of valuation.
- Read industry publications and research reports.
- Attend conferences and workshops.
- Network with other professionals in the field.
- Seek out mentors and advisors.
9.3 Empowering Your Decision-Making
By mastering the art of comparable company analysis, you can empower your decision-making and achieve your financial goals. Whether you’re an investor, analyst, or business owner, CCA can provide you with the insights you need to make informed choices and create value.
Remember, valuation is not an exact science, but with the right tools and techniques, you can significantly improve your chances of success.
Ready to take your investment decisions to the next level? Visit COMPARE.EDU.VN today and unlock a world of comprehensive comparisons and data-driven insights. Our platform is designed to empower you with the knowledge you need to make smart, informed choices.
Stop guessing and start knowing. Head over to COMPARE.EDU.VN now and discover the difference that accurate, objective comparisons can make.
Contact us:
Address: 333 Comparison Plaza, Choice City, CA 90210, United States
Whatsapp: +1 (626) 555-9090
Website: COMPARE.EDU.VN
10. FAQ Section
1. What is Comparable Company Analysis (CCA)?
Comparable Company Analysis (CCA) is a valuation technique that determines the value of a company by comparing it to the metrics of similar publicly traded companies.
2. How do I choose comparable companies?
Select companies in the same industry with similar business models, revenue size, growth rates, and risk profiles.
3. What are the key valuation multiples used in CCA?
Common multiples include Price-to-Earnings (P/E), Enterprise Value-to-EBITDA (EV/EBITDA), and Price-to-Sales (P/S).
4. What are the advantages of using CCA?
CCA is market-driven, relatively simple, objective, useful for benchmarking, and widely accepted in the finance industry.
5. What are the disadvantages of using CCA?
CCA depends on the availability of comparables, can be distorted by market inefficiencies, lacks a forward-looking perspective, and ignores intrinsic value.
6. How can I mitigate the disadvantages of CCA?
Carefully select the peer group, adjust for differences, use multiple valuation methods, consider market conditions, and perform sensitivity analysis.
7. What are some common mistakes to avoid in CCA?
Neglecting qualitative factors, ignoring non-recurring items, using stale data, applying inappropriate multiples, and failing to consider market conditions.
8. Can CCA be used for private companies?
Yes, but adjustments must be made, such as applying a discount for lack of marketability (DLOM).
9. How does COMPARE.EDU.VN enhance CCA?
compare.edu.vn provides streamlined comparisons, comprehensive data analysis, objective information, customizable criteria, and real-time updates.
10. Where can I find more information about CCA?
Consult financial textbooks, industry publications, and reputable websites such as Investopedia and Wall Street Prep.