President Trump frequently asserted that he built the “greatest ever US economy” before the coronavirus pandemic and that the subsequent recovery was “faster than ever.” While the US economy showed positive trends before the pandemic, it’s crucial to compare his economic performance with that of his predecessor, Barack Obama, to gain a comprehensive understanding. This analysis examines key economic indicators under both presidencies, providing a data-driven comparison.
GDP Growth: A Tale of Two Halves and a Pandemic
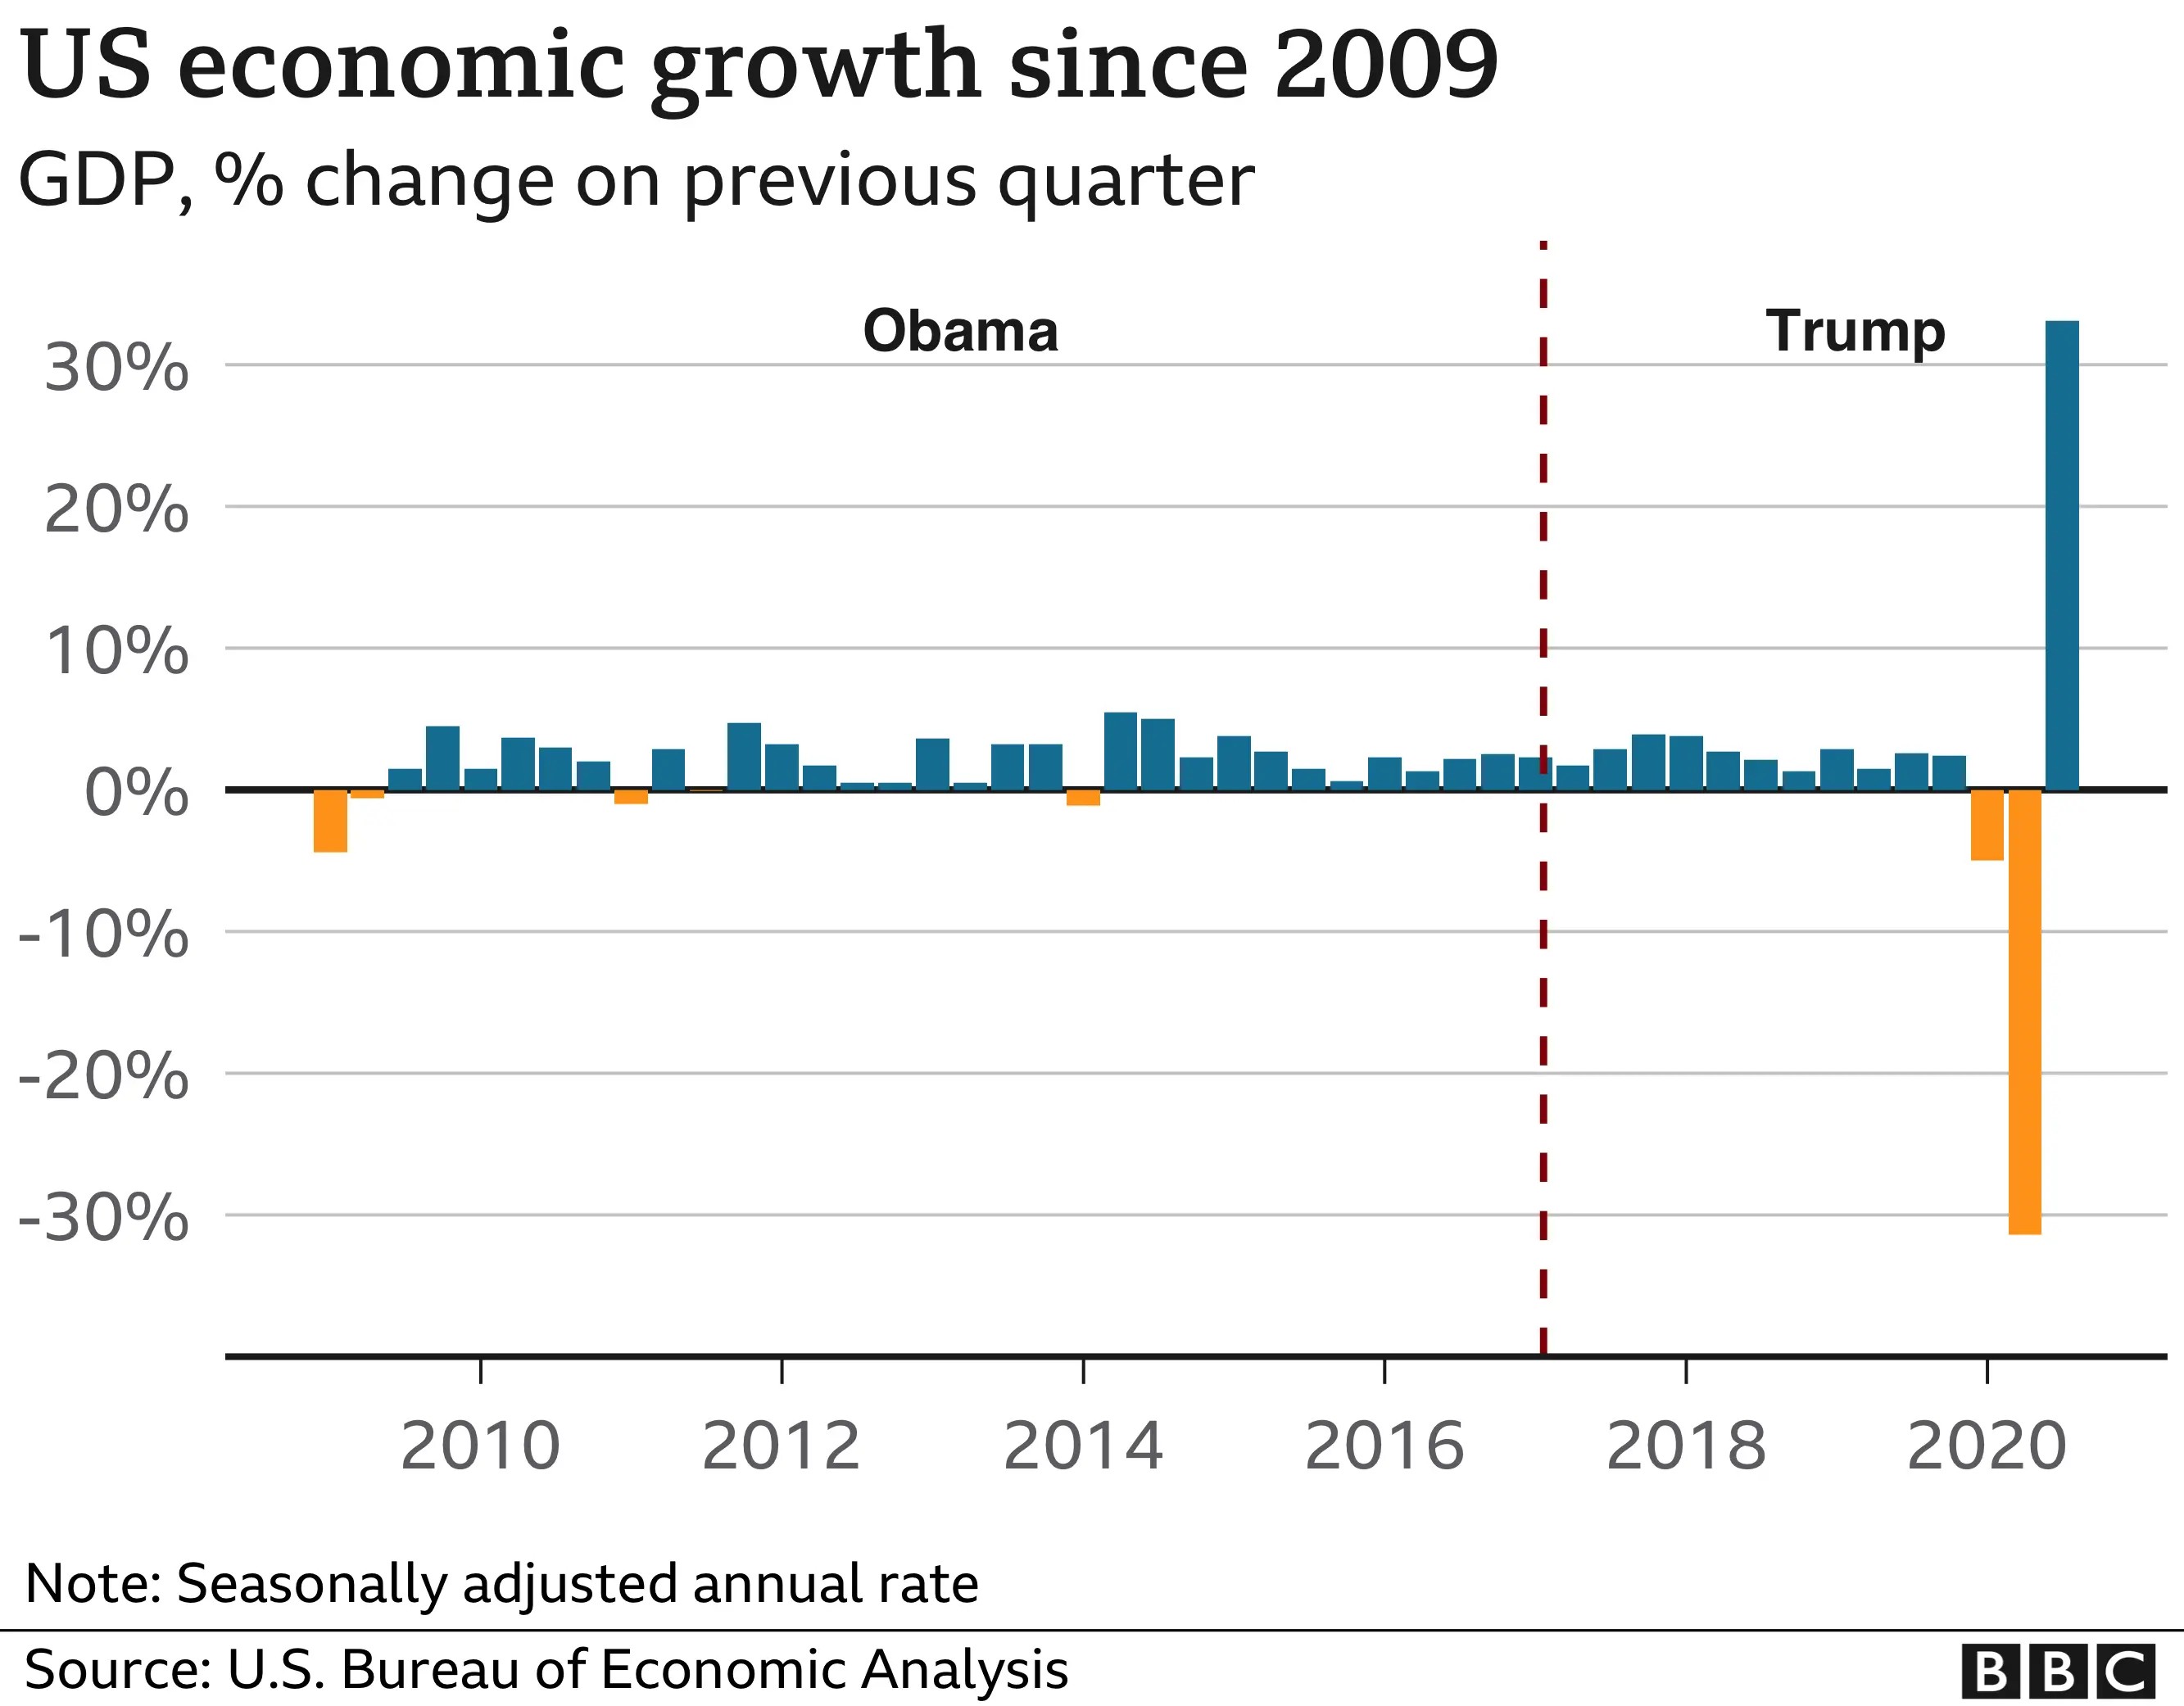
Examining GDP growth, the data reveals a nuanced picture. The most recent figures highlight a significant annualized surge of 33% in the third quarter of 2020 under Trump, rebounding from the pandemic-induced contraction. However, this recovery didn’t fully restore economic activity to pre-pandemic levels. While Trump touted this as “the biggest in the history of our country,” it was roughly double the previous peak, not triple, and less than the growth experienced by some European economies during the same period.
Looking at the broader picture, during President Trump’s first three years, the average annual GDP growth was 2.5%. Interestingly, the final three years of the Obama administration demonstrated a similar average growth of 2.3%. Historically, the US economy has experienced periods of considerably higher growth rates, such as the early 1950s, indicating that while Trump’s economy was growing, it wasn’t unprecedentedly strong when compared to previous eras or even Obama’s later years.
Stock Market Performance: Dow Jones Under Obama and Trump
President Trump frequently emphasized the stock market’s performance, particularly the Dow Jones Industrial Average, as a key indicator of his economic success. The Dow Jones reached record highs at the beginning of 2020 under Trump. However, the onset of the coronavirus pandemic caused a sharp market downturn, erasing the gains made since his inauguration. While markets showed resilience and largely recovered to pre-pandemic levels, fluctuations persisted.
It’s important to note that the stock market’s upward trend began well before Trump’s presidency. The Dow Jones also experienced significant growth during Obama’s second term, recovering from the 2008 financial crisis and steadily climbing. Therefore, while the stock market performed well under Trump initially, attributing this solely to his policies overlooks the preceding upward trajectory that began during the Obama administration.
Unemployment Rate: Lowest in 50 Years, But Context Matters
President Trump rightfully claimed the lowest unemployment rate in half a century before the pandemic, reaching 3.5% in February 2020. This was indeed a significant achievement. However, when comparing job creation, the Obama administration added more jobs during a comparable timeframe. In the three years before the pandemic under Trump, 6.4 million jobs were added, while the last three years of Obama’s presidency saw the addition of 7 million jobs.
The pandemic triggered a dramatic surge in unemployment, reaching 14.7% in April 2020, the highest since the Great Depression. Over 20 million jobs were lost, wiping out a decade of employment gains in a single month. While unemployment decreased to 7.9% by September 2020, the economic shock of the pandemic significantly impacted the unemployment landscape under Trump’s tenure, especially when compared to the steady improvement seen in the later Obama years.
Real Wage Growth: Continuing a Trend
Real wages, adjusted for inflation, increased throughout Trump’s first three years, continuing an upward trend that began during Obama’s first term. This growth peaked at 2.1% per annum in February 2019, before the pandemic. However, this peak was lower than the 2.4% real wage increases seen under Obama in 2015.
The initial surge in average earnings at the start of the pandemic was largely due to lower-wage earners disproportionately losing their jobs, skewing the average wage upwards. As economic restrictions eased, average wages began to decline again. This highlights that while wage growth continued under Trump, it was part of a pre-existing trend and experienced pandemic-related distortions.
Poverty Reduction: Significant, But Not Unprecedented
In 2019, President Trump claimed to have achieved “the largest poverty reduction under any president in history.” Official data showed a significant reduction of 4.2 million people living in poverty in 2019 compared to the previous year. While substantial, this was not the largest reduction on record. The largest single-year decrease occurred in 1966 under President Lyndon B Johnson, with almost 4.7 million people lifted out of poverty.
Poverty rates had risen sharply during the 2007/08 financial crisis but began declining around 2015 during the Obama administration, driven by economic growth and increased employment. The continued economic strength under Trump (pre-pandemic) contributed to further poverty reduction, but it built upon the trend initiated during the later Obama years. It’s also crucial to note that these national figures mask disparities across regions and ethnic groups, and 2020 figures are expected to show a pandemic-related increase in poverty.
Conclusion: Continuity and Crisis
In conclusion, the US economy under President Trump, prior to the pandemic, demonstrated continued growth and positive trends in key areas like unemployment, wage growth, and poverty reduction. However, when directly compared to the economic performance during Barack Obama’s second term, many indicators show similar or even stronger performance under Obama in certain aspects. The unprecedented economic shock of the coronavirus pandemic significantly impacted the latter part of Trump’s presidency, creating a starkly different economic landscape compared to the more stable and recovering economy he inherited from Obama. Ultimately, while both presidencies oversaw periods of economic expansion, attributing unique economic exceptionalism to either requires careful consideration of broader economic trends and historical context.