A comparative map is a powerful tool for contrasting different types of information.
What is a Comparative Map?
A comparative map, also known as a comparison chart or table, is a study and presentation tool used to contrast two or more elements by examining their similarities, differences, and distinctive characteristics.
It can be used to compare various elements such as objects, ideas, processes, theories, concepts, events, people, options, topics, and phenomena.
This tool employs rows and columns to organize specific content logically, concisely, and visually. This representation method facilitates the reading and understanding of information. It is commonly used in diverse contexts, including academic, educational, and professional settings, to aid in decision-making, studying, delivering presentations, or choosing between multiple options.
For example, a smartphone brand might showcase two of its best-selling products on its website, using a comparative map to highlight the unique features of each, such as memory, battery, weight, and screen size. This allows customers to easily compare the products and select the one that best suits their needs.
| V Phone 10 | V Phone 12 |
|---|---|
| Memory | 64 GB |
| Weight | 198 g |
| Battery | 5000 mAh |
| Screen Size | 6.5 inches |
| Screen Resolution | 720 x 1560 px |
| Available Colors | Black, Blue |
| Wifi | Yes |
| Bluetooth | Yes |
See also: Graphic Organizers
Characteristics of a Comparative Map
A comparative map is characterized by:
- Simplicity. It is easily understood because the comparison of features between elements is clearly displayed.
- Synthesis. It concisely summarizes the most important characteristics of each element in a precise manner.
- Versatility. It can be used to compare elements of different natures and across various disciplines.
- Scalability. It can compare as many features and elements as needed, although it is advisable to keep the number manageable for clarity.
You might be interested in: Outline
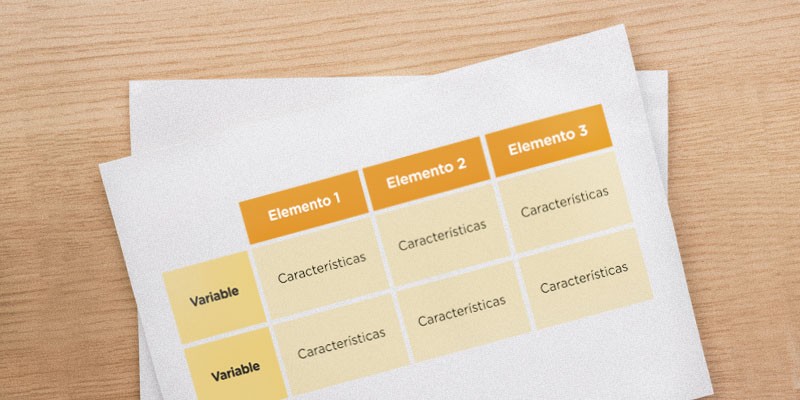
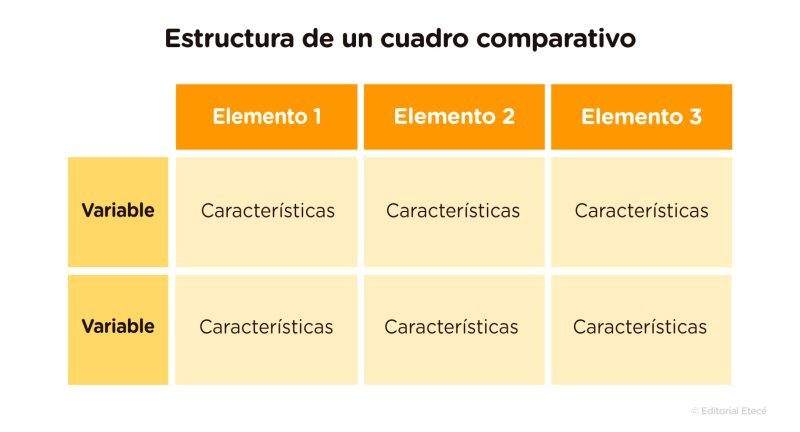
Structure of a Comparative Map
Graphically, a comparative map consists of rows and columns and can contain both qualitative information (expressing characteristics and qualities) and quantitative information (stating numerical data).
Additionally, comparative maps include:
- Two or More Elements. These are the names of the objects, concepts, or facts being compared. They are typically placed in the first row, one per column.
- Characteristics. These are the names, descriptions, or statements that provide information about the elements. They are listed under each element’s name, one per cell.
- Variables or Categories. These are names or descriptions found in some comparative maps that indicate the category being compared. They are usually placed in the first column, one per row.
More on: Diagram
Types of Comparative Maps
Based on their structure and information arrangement, different types of comparative maps exist. The main types are:
1. Tabular Comparative Map
This is the most common type of comparative map, featuring two or more columns. The top margin of each column names the elements or phenomena being compared, and each row lists the distinctive features.
For example:
| Reptiles | Amphibians |
|---|---|
| Mostly live outside of water (though some can live in it) and in warm environments. | Inhabit humid environments both in and out of water. |
| Carnivorous diet. | Mostly carnivorous. |
| Body covered in scales made of keratin, which is hard and resistant. | No scales, skin is moist and cold. |
| Oviparous reproduction. | Oviparous reproduction. |
| Cold-blooded animals. | Cold-blooded animals. |
| More than 9500 species of reptiles, such as snakes, lizards, and turtles. | More than 7500 species of amphibians, such as frogs, toads, and salamanders. |
2. Matrix Comparative Map
This type of comparative map is a double-entry table. It has columns for the different objects or elements being compared and rows for the variables used to distinguish, compare, or characterize these elements. For example:
| Reptiles | Amphibians | |
|---|---|---|
| Habitat Type | Humid or dry environments, mostly terrestrial. | Humid environments, living both in water and on land. |
| Diet | Mostly carnivorous. | Mostly carnivorous. |
| Body Covering | Covered by keratin scales, hard and resistant. | Soft and moist skin. |
| Reproduction | Reproduce through eggs (hard-shelled). | Reproduce through eggs (soft-shelled). |
| Respiration | Pulmonary respiration. | Can have branchial, pulmonary, or skin respiration depending on their development stage. |
| Blood Type | Mostly ectothermic. | Ectothermic. |
| Number of Species | More than 9500. | More than 7500. |
| Examples | Snake, turtle, crocodile. | Frog, toad, salamander. |
How to Make a Comparative Map
The main steps to create a comparative map are:
- Gather Information. Consult reliable sources to obtain clear and verified information. This ensures a thorough understanding of each element to be analyzed and the variables or characteristics that define them.
- Identify Elements to Compare. Before creating the map, determine which elements and how many will be compared.
- Determine Variables or Categories. Research and list the variables or characteristics that will be compared. Will you focus on similarities, differences, or the main features of each element?
- List Characteristics. Based on the variables or categories, note how each characteristic is presented in each element.
- Construct the Map. Draw a table on paper or digitally and divide it into as many sections as elements and characteristics to be compared. In the top cell of each column, write the names of the elements being compared. Below each name, list the characteristics, similarities, or differences, each in a separate cell. For matrix comparative maps, include a column on the left to identify the variables or categories of comparison.
- Draw Conclusions. Once the map is complete, analyze it item by item to draw conclusions about the topic of study.
What is a Comparative Map Used For?
Comparative maps are used in educational, academic, business, institutional, and personal contexts for various purposes due to their ability to contrast two or more elements:
- Representing Study Material. They are used in different subjects as summaries because information is more easily visualized and understood. They are effective tools for memorizing educational content.
- Simplifying Information for Explanation. They are used as support material in training sessions, lectures, and presentations to help speakers remember key points and allow audiences to perceive the contrast between elements.
- Analyzing the Best Option. They are used for decision-making and choosing the most suitable solution, product, or procedure.
Advantages and Disadvantages of a Comparative Map
Comparative maps offer several advantages:
- Easy to Create. They can be quickly made by hand or digitally in a short amount of time.
- Effective Information Presentation. They can simplify complex information in an organized manner.
- Simple Interpretation. They are easy to understand without much effort, and information can be found quickly.
- Versatile for Various Topics. They can be used to diagram information from different fields of knowledge.
- Multi-Purpose Tools. They can be used for studying, arguing points, summarizing information in texts or manuals, and more.
However, they also have some disadvantages:
- Lack of Visual Links Between Ideas. Unlike other types of diagrams, it’s not possible to link concepts with arrows or other graphical marks.
- Potential Omission of Information. As summaries, they do not include all details of a topic.
- Requires Prior Analysis. They necessitate a detailed analysis of the topic being represented, which can be time-consuming in some cases.
Examples of Comparative Maps
1. Animal Cell vs. Plant Cell
| Animal Cell | Plant Cell |
|---|---|
| Eukaryotic cell type (with a nucleus). | Eukaryotic cell type (with a nucleus). |
| Present in animals. | Present in plants. |
| Contains a nucleus, membrane, and cytoplasm. | Contains a nucleus, membrane, and cytoplasm. |
| Lacks chloroplasts and a cell wall, but has a cell membrane. | Has chloroplasts (for photosynthesis) and a cell wall. |
| Heterotrophic nutrition. | Autotrophic nutrition. |
| One or more small vacuoles. | One large central vacuole. |
2. Short Story vs. Novel
| Short Story | Novel |
|---|---|
| Genre | Part of the narrative genre. |
| Length | Typically brief. |
| Structure | Introduction, rising action, climax, falling action, and resolution structure. |
| Plot | Single main plot. |
| Characters | One or several main characters and few secondary characters. |
| Time and Setting | Located in a specific time and space. |
3. Baroque vs. Renaissance
| Baroque | Renaissance |
|---|---|
| Emerged in the 17th century. | Emerged in the 15th century. |
| Overly ornate style with complex rhetorical devices. | Classical style, respecting ideals of harmony and balance. |
| Main themes: Christianity, love, decadence, pessimism, and disillusionment. | Main themes: Greco-Latin mythology, love, anthropocentrism, melancholy, and nature. |
| Sought to create striking and exuberant pieces. | Sought beauty and symmetry. |
4. Mexico and its Bordering Countries
| Mexico | United States | Belize | Guatemala |
|---|---|---|---|
| Capital City | Mexico City | Washington D.C. | Belmopan |
| Area | 1,964,375 km² | 9,147,593 km² | 22,966 km² |
| Population | Over 131 million inhabitants | Over 334 million inhabitants | Over 380 thousand inhabitants |
| Official Language | Spanish and 68 indigenous languages | English (in 32 states) | English |
| Government Type | Federal presidential constitutional republic | Federal presidential republic | Parliamentary constitutional monarchy |
| Political Divisions | 32 federal entities | 50 states | 6 districts |
| Currency | Mexican Peso | United States Dollar | Belize Dollar |
Continue learning about: