Comparing columns in Excel is a fundamental skill for anyone working with data. Whether you are reconciling financial records, updating inventory lists, or ensuring data consistency, the ability to efficiently compare two columns and identify differences is invaluable. Microsoft Excel provides a variety of built-in features and formulas to accomplish this, ranging from simple visual checks to sophisticated functions. This guide will explore multiple techniques to compare two columns in Excel for differences, helping you choose the most effective method for your specific needs.
Row-by-Row Comparison: Spotting Differences in Each Row
One common scenario is comparing data on a row-by-row basis. This is particularly useful when you want to see if corresponding entries in two columns are the same or different. Excel’s IF function is perfectly suited for this task.
Example 1: Basic Match or Difference Check
Let’s start with the simplest comparison: determining if values in two columns of the same row are either a match or different.
Formulas for Basic Comparison:
To implement this, you’ll add a new column and use an IF formula to compare the cells in each row.
-
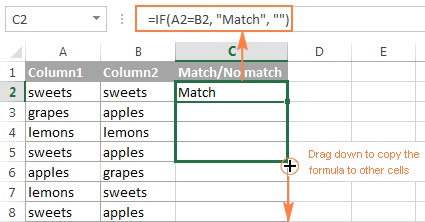
Formula for Matches:
=IF(A2=B2,"Match","")This formula, placed in cell C2 and dragged down, compares cell A2 to B2. If they are identical, it displays “Match”; otherwise, it leaves the cell blank.
-
Formula for Differences:
=IF(A2<>B2,"Difference","")Changing the operator to
<>(not equal to) allows you to highlight differences. This formula in C2 will show “Difference” if A2 and B2 are not the same. -
Formula for Matches and Differences with Clear Labels:
=IF(A2=B2,"Match","Difference")or
=IF(A2<>B2,"Difference","Match")These formulas provide more explicit labels, displaying either “Match” or “Difference” depending on the comparison.
These formulas work seamlessly with various data types, including numbers, dates, times, and text strings.
Tip: For enhanced row-by-row comparison, consider using Excel’s Advanced Filter. It allows you to filter your data to show only matches or differences based on criteria between two columns.
Example 2: Case-Sensitive Comparison
By default, Excel’s comparison formulas are not case-sensitive. If you need to differentiate between “Apple” and “apple”, the EXACT function is the solution.
Formulas for Case-Sensitive Comparison:
-
Case-Sensitive Matches:
=IF(EXACT(A2, B2), "Match", "")EXACT(A2, B2)returns TRUE only if A2 and B2 are exactly the same, including case. TheIFfunction then displays “Match” for case-sensitive matches. -
Case-Sensitive Differences:
=IF(EXACT(A2, B2), "Match", "Difference")This formula uses
EXACTto identify case-sensitive matches and labels non-matches as “Difference”.
Comparing Multiple Columns in Excel
Sometimes, you need to compare more than two columns within the same row to find differences or similarities. Excel offers solutions for these scenarios as well.
Example 1: Finding Differences Across All Columns in a Row
Imagine you have several columns of data, and you want to identify rows where all cells have identical values.
Formula for Finding Differences Across All Columns:
=IF(COUNTIF($A2:$E2, $A2)=5, "Same in All", "Difference")In this formula:
$A2:$E2is the range of columns you are comparing in the current row.$A2is the first cell in the row, used as the value to count.COUNTIF($A2:$E2, $A2)counts how many times the value in A2 appears within the range A2:E2.=5checks if the count equals 5 (the number of columns being compared). If it does, it means all cells in the row have the same value as A2, indicating a “Same in All” row. Otherwise, it’s marked as “Difference”.
Example 2: Identifying Differences in Any Two Columns within a Row
Conversely, you might want to find rows where any two columns have different values.
Formula for Identifying Differences in Any Two Columns:
=IF(OR(A2<>B2, B2<>C2, A2<>C2), "Difference", "Same in All")This formula utilizes the OR function to check for differences:
OR(A2<>B2, B2<>C2, A2<>C2)checks if any of the pairwise comparisons between columns A, B, and C are “not equal”. If any of these conditions are true, theORfunction returns TRUE.- If
ORis TRUE (meaning there’s at least one difference), the formula displays “Difference”; otherwise, if all compared columns are the same, it shows “Same in All”.
For a larger number of columns, instead of a long OR statement, you can use a combination of COUNTIF functions, although the complexity increases.
Comparing Two Columns for Unique Entries and Missing Values
Beyond row-by-row comparisons, you often need to compare two entire columns (or lists) to identify values that are present in one but not the other. This is crucial for finding unique entries or missing values.
Formula for Identifying Unique Values (Differences between Columns):
=IF(COUNTIF($B:$B, $A2)=0, "Unique to Column A", "")This formula, placed in column C alongside column A, works as follows:
COUNTIF($B:$B, $A2)counts how many times the value in cell A2 appears in the entire column B ($B:$B).=0checks if the count is zero. If it is, it means the value from A2 is not found in column B, making it “Unique to Column A”. Otherwise, the cell is left blank, indicating the value is also present in column B.
Tip: For performance optimization with large datasets, instead of referencing entire columns ($B:$B), specify a more limited range (e.g., $B$2:$B$1000) if you know the approximate size of your data.
Alternative formulas to achieve the same result include using ISERROR with MATCH or array formulas with SUM, but COUNTIF is generally more straightforward and efficient for this purpose.
Highlighting Differences Visually with Conditional Formatting
Formulas are excellent for programmatically identifying differences, but sometimes visual cues are more effective, especially for quickly reviewing data. Excel’s Conditional Formatting feature lets you highlight cells based on specific criteria, making differences immediately apparent.
Example 1: Highlighting Row-by-Row Differences
To visually highlight cells in column A that are different from their corresponding cells in column B in the same row:
- Select the cells in column A you want to compare.
- Go to Home > Conditional Formatting > New Rule.
- Choose “Use a formula to determine which cells to format”.
- Enter the formula
=$B2<>$A2(assuming row 2 is the first data row, and you are starting the selection from A2). Ensure you use a relative row reference for column B (no$before the row number). - Click Format to choose a highlight color and click OK.
To highlight matches instead, use the formula =$B2=$A2 in the conditional formatting rule.
Example 2: Highlighting Unique Values in Lists
Conditional formatting can also highlight values that are unique to one list when comparing two columns.
Highlighting Unique Values in Column A (List 1):
- Select the range of data in Column A (e.g., A2:A10).
- Create a New Conditional Formatting Rule using the formula:
=COUNTIF($C$2:$C$10, $A2)=0(assuming Column C contains List 2, C2:C10). - Choose your desired highlight format.
Highlighting Unique Values in Column C (List 2):
- Select the range of data in Column C (e.g., C2:C10).
- Create a New Conditional Formatting Rule using the formula:
=COUNTIF($A$2:$A$10, $C2)=0(referencing the range of List 1 in Column A). - Choose your highlight format.
Example 3: Highlighting Matching Values (Duplicates)
To highlight values that are present in both lists (duplicates):
Highlighting Matches in Column A (List 1):
- Select the range in Column A.
- New Conditional Formatting Rule with formula:
=COUNTIF($C$2:$C$10, $A2)>0. - Format as desired.
Highlighting Matches in Column C (List 2):
- Select the range in Column C.
- New Conditional Formatting Rule with formula:
=COUNTIF($A$2:$A$10, $C2)>0. - Format as desired.
Comparing Differences Across Rows in Multiple Columns Using “Go To Special”
For a quick, formula-free way to highlight row differences across multiple columns, Excel’s “Go To Special” feature is incredibly useful.
Steps to Highlight Row Differences:
- Select the range of cells you want to compare across rows.
- Go to Home > Find & Select > Go To Special.
- In the “Go To Special” dialog box, select “Row differences” and click OK.
- Excel will select cells that are different from the “comparison cell” in each row (by default, the topmost cell in your selection is the comparison cell).
- Apply a Fill Color from the Home tab to highlight the selected difference cells.
You can change the “comparison column” by using the Tab or Enter key to move the active cell within your selection.
Formula-Free Column Comparison Using Ablebits Compare Tables Add-in
While Excel’s built-in features are powerful, specialized add-ins like Ablebits Compare Tables can streamline the process of comparing columns, especially for complex scenarios.
Using Ablebits Compare Tables Add-in:
- Install and launch the Ablebits Ultimate Suite add-in in Excel.
- Click the “Compare Tables” button on the Ablebits Data tab.
- Select your first column/list (Table 1) and click Next.
- Select your second column/list (Table 2) and click Next.
- Choose the type of data to find: “Unique values” (differences) or “Duplicate values” (matches).
- Select the columns for comparison.
- Choose how to handle the results: “Highlight with color” or “Identify in the Status column”.
- Click “Finish”.
This add-in provides a user-friendly interface to perform column comparisons, offering options for highlighting or adding status columns to clearly indicate matches and differences.
Conclusion
Comparing two columns in Excel for differences can be achieved through various methods, from basic IF formulas for row-by-row checks to conditional formatting for visual cues and specialized add-ins for advanced scenarios. The best approach depends on the complexity of your data, the desired level of detail, and your preferred workflow. By mastering these techniques, you can significantly enhance your data analysis capabilities in Excel and efficiently manage and validate your information.
Download the Excel examples:
Compare Excel Lists – examples (.xlsx file)
Try Ablebits Ultimate Suite (Trial Version):
Ultimate Suite – trial version (.exe file)