Navigating the world of financial statements can be daunting, but understanding how to prepare a comparative balance sheet is essential for assessing a company’s financial health and tracking its progress over time. COMPARE.EDU.VN offers a comprehensive guide on comparative balance sheets, providing clear steps and insights into financial analysis. Discover the tools and techniques needed for effective financial statement analysis, improved financial decision-making, and strategic financial planning for your business, supported by the principles of financial statement comparison and balance sheet comparison.
1. Understanding the Comparative Balance Sheet
A comparative balance sheet is a vital financial tool that presents a company’s financial position at two or more points in time, typically across accounting periods, to identify trends and changes. It showcases assets, liabilities, and equity, facilitating analysis of absolute changes over specified periods. This approach helps in understanding the company’s financial performance and identifying both growth opportunities and potential financial risks.
For instance, analyzing Company XYZ’s balance sheets for 2022 and 2023 helps in observing changes in assets, liabilities, and equity. This in-depth analysis is crucial for assessing financial stability and achieving business objectives. The comparative balance sheet, presented by COMPARE.EDU.VN, offers a clear picture of a company’s financial trajectory.
 Understanding Comparative Balance Sheet
2. Key Components of a Comparative Balance Sheet
A comprehensive comparative balance sheet typically includes three primary sections:
2.1. Assets
Assets are the resources owned by the company. These are categorized into:
- Current Assets: Resources expected to convert into cash within one year, such as cash, accounts receivable, and inventory.
- Non-Current Assets: Resources expected to provide benefits for more than one year, including property, plant, equipment, and long-term investments.
Understanding these assets helps in gauging a company’s liquidity and long-term investment strategies, which are critical for evaluating financial health.
2.2. Liabilities
Liabilities represent the company’s obligations or debts. These are also divided into:
- Current Liabilities: Obligations due within one year, such as accounts payable and short-term loans.
- Non-Current Liabilities: Long-term debts and obligations that extend beyond one year, including deferred tax liabilities.
Assessing liabilities is crucial to understanding a company’s debt management and financial risk exposure.
2.3. Shareholders’ Equity
Shareholders’ Equity, also known as stockholders’ equity or owners’ equity, represents the residual interest in the company’s assets after deducting liabilities. It includes:
- Common Stock: The initial investments made by shareholders.
- Retained Earnings: Accumulated profits over time that are reinvested in the business.
- Additional Paid-in Capital: Amounts paid by investors above the par value of the stock.
This section is vital for understanding the ownership structure and the financial strength of the company from an equity perspective.
3. Essential Formulas and Calculations for Analysis
To effectively analyze a comparative balance sheet, certain formulas and calculations are necessary to derive meaningful insights.
3.1. Percentage Change Formula
This formula helps in determining the rate at which a particular item has changed between two periods:
*Percentage Change = ((Current Year Value – Previous Year Value) / Previous Year Value) 100**
This calculation highlights the magnitude and direction of changes, providing a quick view of key performance indicators.
3.2. Working Capital Formula
Working capital measures a company’s short-term liquidity:
Working Capital = Current Assets – Current Liabilities
A positive working capital indicates a company’s ability to cover its short-term obligations, while a negative working capital may signal liquidity issues.
3.3. Current Ratio Formula
The current ratio assesses a company’s ability to meet its short-term obligations:
Current Ratio = Current Assets / Current Liabilities
A ratio greater than 1 indicates the company has enough assets to cover its current liabilities, providing a measure of financial stability.
3.4. Debt-to-Equity Ratio Formula
This ratio gauges a company’s leverage or financial leverage:
Debt-to-Equity Ratio = Total Liabilities / Shareholders’ Equity
A high ratio indicates the company relies heavily on debt financing, which could increase financial risk.
3.5. Return on Assets (ROA) Formula
ROA measures a company’s efficiency in generating net profit relative to its total assets:
ROA = Net Income / Average Total Assets
This helps assess how effectively a company utilizes its assets to generate earnings.
3.6. Return on Equity (ROE) Formula
ROE evaluates a company’s profitability to its shareholders’ equity:
ROE = Net Income / Average Shareholders’ Equity
This provides insights into the company’s ability to generate returns for its shareholders’ investments.
4. Practical Example of a Comparative Balance Sheet Analysis
Let’s consider Company ABC’s comparative balance sheet for 2022 and 2023 to understand how it is analyzed.
Company ABC – Comparative Balance Sheet
As of December 2022 and December 2023
| 2022 | 2023 | Percentage Change | |
|---|---|---|---|
| Assets | |||
| Current Assets | |||
| Cash and Cash Equivalents | $65,000 | $80,000 | 23.08% |
| Accounts Receivable | $52,000 | $60,000 | 15.38% |
| Inventory | $55,000 | $50,000 | -9.09% |
| Prepaid Expenses | $12,000 | $14,000 | 16.67% |
| Total Current Assets | $184,000 | $204,000 | 10.87% |
| Non-Current Assets | |||
| Property, Plant, and Equipment | $220,000 | $240,000 | 9.09% |
| Intangible Assets | $38,000 | $35,000 | -7.89% |
| Investments | $35,000 | $40,000 | 14.29% |
| Total Non-Current Assets | $293,000 | $315,000 | 7.51% |
| Total Assets | $477,000 | $519,000 | 8.81% |
| Liabilities and Shareholders’ Equity | |||
| Current Liabilities | |||
| Accounts Payable | $28,000 | $26,000 | -7.14% |
| Short-Term Debt | $12,000 | $14,000 | 16.67% |
| Accrued Liabilities | $18,000 | $20,000 | 11.11% |
| Total Current Liabilities | $58,000 | $60,000 | 3.45% |
| Non-Current Liabilities | |||
| Long-Term Debt | $90,000 | $80,000 | -11.11% |
| Deferred Tax Liabilities | $18,000 | $16,000 | -11.11% |
| Other Long-Term Liabilities | $6,000 | $7,000 | 16.67% |
| Total Non-Current Liabilities | $114,000 | $103,000 | -9.65% |
| Total Liabilities | $172,000 | $163,000 | -5.23% |
| Shareholders’ Equity | |||
| Common Stock | $50,000 | $50,000 | 0% |
| Retained Earnings | $255,000 | $306,000 | 20% |
| Additional Paid-in Capital | $10,000 | $10,000 | 0% |
| Total Shareholders’ Equity | $315,000 | $366,000 | 16.19% |
| Total Liabilities and Equity | $477,000 | $529,000 | 10.90% |
4.1. Key Observations
- Asset Growth: Total assets increased by 8.81%, driven mainly by an increase in cash and cash equivalents (23.08%) and property, plant, and equipment (9.09%).
- Liability Management: Total liabilities decreased by 5.23%, primarily due to a reduction in long-term debt (-11.11%) and deferred tax liabilities (-11.11%).
- Equity Enhancement: Shareholders’ equity grew by 16.19%, primarily due to a significant increase in retained earnings (20%), indicating improved profitability and reinvestment in the business.
This analysis demonstrates how a comparative balance sheet facilitates the identification of financial trends and supports informed decision-making.
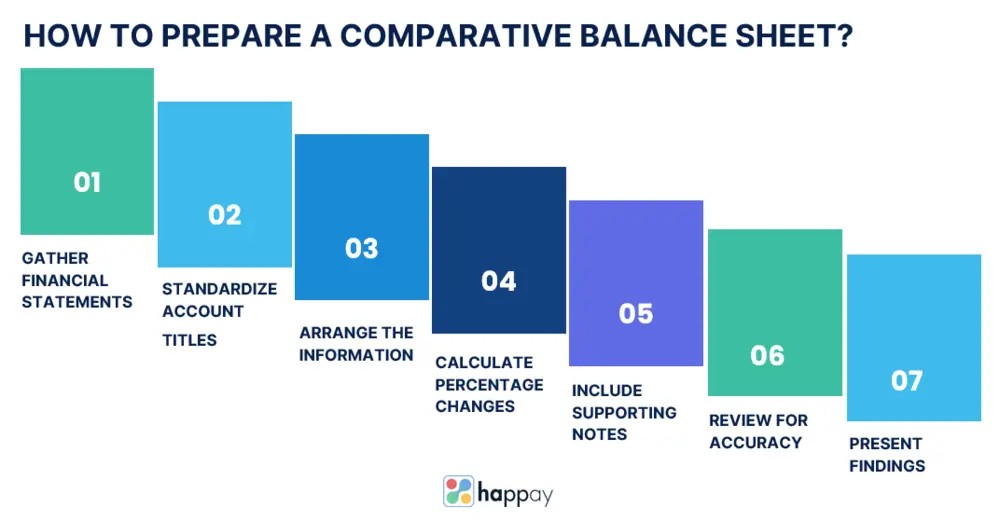
5. How to Prepare a Comparative Balance Sheet: Step-by-Step Guide
Preparing a comparative balance sheet involves several key steps to ensure accuracy and usefulness.
5.1. Gather Financial Statements
Collect balance sheets from the accounting periods you wish to compare. Ensure these statements provide a detailed breakdown of assets, liabilities, and equity.
5.2. Standardize Account Titles
Ensure consistent account titles across all periods to guarantee accurate comparisons. For example, “Accounts Receivable” should be labeled consistently in all periods.
5.3. Arrange the Information
Set up a table or spreadsheet with corresponding account titles and organize the data into columns for each accounting period. Typically, the most recent period is placed on the right, with older periods to the left.
5.4. Calculate Percentage Changes
Calculate the percentage change between periods for each line item using the formula: ((Current Year Value – Previous Year Value) / Previous Year Value) * 100.
5.5. Include Supporting Notes
Document significant events, such as mergers or divestitures, with relevant footnotes to provide context for the changes observed in the balance sheet.
5.6. Review for Accuracy
Double-check all figures and calculations to ensure accuracy. Errors in one period’s balance sheet can lead to misleading conclusions.
5.7. Present Findings
Share the comparative balance sheet and analysis with relevant stakeholders, including investors, management, and the board of directors.
6. Advantages of Using Comparative Balance Sheets
Using comparative balance sheets offers numerous advantages for financial analysis and decision-making.
6.1. Spotting Trends and Patterns
Comparing data from different periods allows for the identification of consistent increases or decreases in assets and liabilities, helping to recognize underlying trends.
6.2. Assessing Financial Performance
Tracking changes in key items like revenue, expenses, assets, and liabilities over time provides insights into how well the company manages its resources.
6.3. Identifying Business Strengths and Weaknesses
The comparison highlights areas of strength and weakness. For example, a consistent increase in cash indicates improved liquidity management.
6.4. Evaluating Efficiency and Productivity
Comparative balance sheets help assess the efficiency of operations, such as analyzing changes in accounts payable and receivable to evaluate credit and collection policies.
6.5. Facilitating Decision-Making
The insights gained from these sheets provide a basis for informed decisions regarding investments, expansion, and cost-cutting measures.
6.6. Monitoring Financial Stability
These sheets help monitor a company’s financial stability by comparing debt levels, equity, and working capital.
6.7. Benchmarking Against Industry Peers
Comparative balance sheets allow companies to compare their performance against industry peers, identifying competitive advantages or areas needing improvement.
6.8. Meeting Regulatory Requirements
Many regulatory bodies and investors require comparative financial statements, ensuring compliance and enhancing credibility.
7. Limitations to Consider
While comparative balance sheets are valuable, they have limitations.
7.1. Limited Context
These sheets provide data but may lack the full context of circumstances influencing financial position changes.
7.2. Time Lag Effect
The interval between periods can reduce the analysis’s relevance due to economic changes or unforeseen events.
7.3. Seasonal Variations
Seasonal fluctuations can skew the analysis, as asset and liability levels vary at different times of the year.
7.4. Inflation and Currency Changes
Inflation and currency fluctuations can distort direct year-to-year comparisons, necessitating adjustments.
7.5. Differences in Accounting Policies
Changes in accounting policies over time can impact the consistency of financial data.
7.6. Non-Financial Factors
These sheets focus solely on financial data, overlooking non-financial factors like market share and customer satisfaction.
7.7. Missing Context on Ratios
The sheets may not directly calculate financial ratios, which offer deeper insights into liquidity and profitability.
7.8. Different Company Sizes
Comparing balance sheets of vastly different sizes can lead to skewed conclusions.
7.9. Non-Standardized Formats
Variations in the presentation of balance sheets due to non-standardized accounting formats can complicate comparisons.
8. Tips for Effective Analysis
To conduct a practical and insightful analysis, consider these tips.
8.1. Ensure Consistent Accounting Policies
Apply accounting policies consistently across periods to avoid distorting data comparability.
8.2. Adjust for Inflation and Currency Changes
Adjust financial data for inflation and currency changes to make meaningful comparisons.
8.3. Calculate Financial Ratios
Complement the analysis with liquidity, solvency, and profitability ratios.
8.4. Focus on Percentage Changes
Pay attention to percentage changes to identify trends and potential financial risks.
8.5. Consider Seasonal Variations
Account for seasonal fluctuations by creating quarterly or monthly comparisons.
8.6. Analyze Working Capital and Cash Flow
Examine working capital trends and changes in operating cash flows.
8.7. Seek External Context
Supplement your analysis with industry trends and market conditions.
8.8. Use Charts and Graphs
Use visual aids to simplify complex data and make trends more apparent.
8.9. Benchmark Against Peers
Compare your company’s balance sheet with competitors or industry peers.
8.10. Consult Financial Experts
Seek guidance from financial experts or professional accountants when facing complex financial data.
9. The Role of Comparative Balance Sheets in Organizational Growth
Comparative balance sheets play a critical role in facilitating organizational growth.
9.1. Tracking Financial Progress
They allow management to assess the impact of business strategies and initiatives on the company’s financial position.
9.2. Identifying Growth Opportunities
These sheets highlight trends in financial data, enabling management to identify potential areas for expansion.
9.3. Optimizing Resource Allocation
Analyzing the sheets helps identify areas where resources might be underutilized, allowing for strategic reallocation.
9.4. Assessing Financial Health
They aid in assessing the company’s financial health by comparing key metrics like liquidity and solvency.
9.5. Understanding Capital Structure
Comparative balance sheets help understand the company’s capital structure, which is crucial for making informed decisions about raising capital.
9.6. Analyzing Efficiency and Productivity
They help track KPIs changes over time, highlighting areas where operational improvements are possible.
9.7. Enhancing Investor Confidence
Transparent financial insights from comparative balance sheets foster investor confidence and attract potential investment.
9.8. Facilitating Strategic Planning
These sheets serve as a valuable input for strategic planning sessions, helping to set realistic goals and establish growth targets.
Unlock the power of comparative balance sheets with COMPARE.EDU.VN. By understanding how to prepare and analyze these financial statements, businesses can make informed decisions, optimize resource allocation, and achieve sustainable growth. Whether you’re tracking financial progress, identifying growth opportunities, or assessing financial health, our comprehensive guide equips you with the knowledge and tools you need. Don’t let financial complexities hold you back—visit COMPARE.EDU.VN today at 333 Comparison Plaza, Choice City, CA 90210, United States, or reach out via WhatsApp at +1 (626) 555-9090. Make informed decisions and drive your business toward success with the support of compare.edu.vn.
10. Frequently Asked Questions (FAQs)
10.1. What is a balance sheet?
A balance sheet displays a company’s financial position, including assets, liabilities, and shareholders’ equity, showcasing what the company owns and owes.
10.2. What is meant by a comparative statement?
A comparative statement presents data from different accounting periods side by side for analyzing trends and performance variations.
10.3. What is the purpose of preparing a comparative balance sheet?
It helps understand changes in a company’s financial position over time, identifying trends, strengths, weaknesses, and growth opportunities, aiding in informed decision-making and strategic planning.
10.4. How is a comparative balance sheet different from a regular balance sheet?
A comparative balance sheet presents data from two or more periods, allowing for comparison, while a regular balance sheet is a single snapshot at a specific date.
10.5. What is a comparative income statement and balance sheet?
A comparative income statement presents revenue, expenses, and net income for multiple periods, while a comparative balance sheet compares a company’s financial position across different accounting periods.
10.6. How can I interpret a comparative balance sheet effectively?
Focus on percentage changes, identify trends, analyze critical ratios, consider external factors, benchmark against peers, and seek professional guidance.
10.7. What is called a comparative statement?
A comparative statement is a financial statement, like a balance sheet or income statement, that presents data from multiple periods for comparison and analysis.
10.8. What are the objectives of a comparative balance sheet?
The objectives include tracking financial progress, identifying growth opportunities, assessing financial health, optimizing resource allocation, and enhancing investor confidence, supporting informed decision-making and organizational success.