Infrared (IR) spectroscopy is a powerful technique for identifying chemical compounds. A common application is comparing two IR spectra to determine if they represent the same substance. This process, known as identity testing, is crucial in industries like pharmaceuticals, food, cosmetics, and nutraceuticals to ensure product quality and safety. This article will delve into the critical factors to consider when comparing two IR spectra.
Controlling Variables for Accurate Comparison
To ensure a valid comparison, it’s essential to control four key variables:
1. Scanning Parameters
- Number of Scans: The number of scans averaged should be identical for both spectra. More scans improve the signal-to-noise ratio, leading to a clearer spectrum.
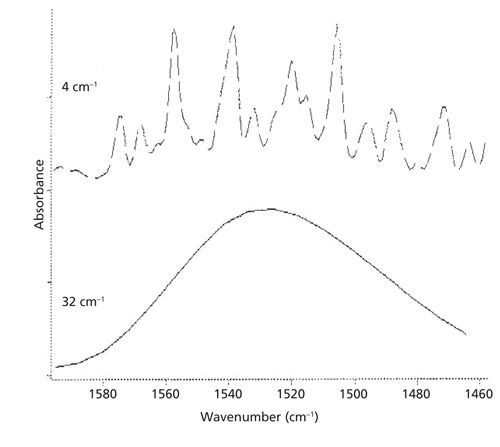
- Instrumental Resolution: The resolution, measured in wavenumbers (cm⁻¹), directly impacts the level of detail in the spectrum. Higher resolution (lower cm⁻¹ value) reveals finer spectral features. Comparing spectra with different resolutions can lead to misinterpretations, as seen in the significant differences between a spectrum of water vapor at 4 cm⁻¹ resolution (showing distinct peaks) and one at 32 cm⁻¹ resolution (appearing as a broad, unresolved band).
- Apodization Function: This mathematical function applied to the interferogram before Fourier transformation affects peak shapes and resolution. Using the same apodization function ensures consistency.
Figure 1: Comparison of water vapor spectra at different resolutions. Top: 4 cm⁻¹ resolution. Bottom: 32 cm⁻¹ resolution.
2. Sample Preparation Technique
The method used to prepare the sample significantly influences the spectrum. For instance, Attenuated Total Reflection (ATR) spectroscopy exhibits a depth of penetration that decreases with increasing wavenumber, causing variations in peak intensities. This is evident in a sucrose spectrum obtained using ATR, where peaks at higher wavenumbers have reduced intensities compared to a spectrum acquired using a non-ATR method. Therefore, using the same sample preparation technique for both spectra is crucial for accurate comparison.
Figure 2: Comparison of sucrose spectra with different sample preparation techniques. Blue: ATR. Red: Non-ATR.
3. Instrument Used
Each instrument introduces unique noise and artifacts into the spectrum. While these differences are typically minor in well-maintained instruments, they can still affect comparisons. Ideally, both spectra should be acquired on the same instrument. When comparing to library spectra, remember that minor discrepancies might arise from instrumental variations.
4. Operator
Even with the same instrument and sample preparation, operator variability can introduce inconsistencies, especially in manual techniques like preparing KBr pellets. Ideally, the same operator should handle both sample and reference measurements. Consistent training and standardized operating procedures are essential when multiple operators are involved.
Prioritizing Variables
While controlling all four variables is ideal, prioritizing is necessary when resources are limited. Scanning parameters must be identical. Sample preparation technique is also crucial. Using the same instrument is highly recommended, while minimizing operator variability enhances reliability.
Determining Alkane Chain Length from IR Spectra
Beyond identity testing, IR spectra can provide insights into the structure of molecules. For instance, the length of alkane chains can be estimated using IR spectroscopy.
- CH₂ Rocking Vibration: The presence of a peak at 720 ± 10 cm⁻¹ indicates an alkyl chain with four or more methylene (CH₂) groups.
- C-H Stretching Region: The relative intensities of methyl (CH₃) and methylene (CH₂) stretching peaks (between 3000 and 2850 cm⁻¹) reflect the CH₂/CH₃ ratio. As chain length increases, the methylene peak becomes more prominent. In long-chain alkanes like petroleum jelly, the methylene peaks can dominate, masking the methyl symmetric stretch. Furthermore, splitting of the CH₂ rocking peak is characteristic of solid, long-chain alkanes.
Figure 3: Comparison of CH₂ and CH₃ stretching peaks in alkanes with different CH₂/CH₃ ratios. Left: Ethyl group (ratio 1). Middle: Hexane (ratio 2). Right: Petroleum jelly (ratio ≥ 16).
While a precise determination of chain length often requires calibration curves, the relative peak heights provide a general indication. Remember that these are general trends, and exceptions exist.
Conclusion
Comparing IR spectra is a valuable tool for chemical identification and structural analysis. By meticulously controlling experimental variables and understanding the factors influencing spectral features, accurate and meaningful comparisons can be achieved, ensuring reliable results in various scientific and industrial applications.