In the realm of data analysis, Excel stands as a powerful tool, especially when it comes to managing and interpreting large datasets. A common task for anyone working with spreadsheets is comparing two columns to identify discrepancies, duplicates, or unique entries. Whether you’re reconciling financial records, cleaning customer databases, or ensuring data integrity across different lists, knowing how to effectively compare columns in Excel for differences is an indispensable skill.
Manually sifting through rows of data in two columns is not only time-consuming but also prone to errors, particularly in extensive spreadsheets. Fortunately, Excel offers a range of built-in features and formulas that can streamline this process, allowing you to quickly pinpoint exactly where your columns diverge.
This guide provides a comprehensive, step-by-step exploration of various methods to compare two columns in Excel for differences. From simple operators to more advanced functions and conditional formatting, we will equip you with the techniques to efficiently analyze your data, uncover valuable insights, and ensure accuracy in your spreadsheets. Whether you are a beginner or an experienced Excel user, mastering these comparison techniques will significantly enhance your data analysis workflow.
Why Comparing Columns for Differences is Crucial in Excel?
Excel’s widespread use in data storage, manipulation, and reporting makes it a cornerstone of informed decision-making across various industries. Data analysts, business professionals, and researchers alike rely on Excel to extract meaningful information from raw data. In this context, the ability to compare columns for differences becomes paramount for several reasons:
- Data Validation and Accuracy: Comparing columns is essential for verifying data accuracy and consistency. It helps identify errors in data entry, inconsistencies across datasets, or discrepancies between expected and actual values. For instance, comparing a sales order column with a delivery confirmation column can quickly reveal orders that haven’t been shipped, ensuring data integrity throughout your workflow.
- Data Cleaning and Deduplication: When managing large datasets, duplicate entries or variations in data format are common issues. Comparing columns can help you pinpoint duplicate entries or identify slight differences (like extra spaces or capitalization variations) that need to be cleaned up. This is crucial for maintaining data quality and avoiding skewed analysis results.
- Identifying Changes and Updates: In dynamic datasets that are regularly updated, comparing columns from different versions can highlight the changes made. This is invaluable for tracking modifications, understanding data evolution over time, and identifying the impact of updates on your analysis.
- Uncovering Insights and Patterns: Beyond data cleaning, comparing columns can reveal hidden patterns and insights. For example, comparing customer purchase history across different product categories can highlight buying trends or customer preferences, informing marketing strategies and product development decisions.
- Efficiency and Time Savings: Automating the column comparison process in Excel saves significant time and effort compared to manual inspection. This efficiency allows you to focus on higher-level analysis and decision-making rather than being bogged down in tedious data sifting.
Essentially, the ability to compare columns for differences is a fundamental step in ensuring data quality, extracting meaningful information, and making data-driven decisions with confidence. Excel provides the tools; understanding how to use them effectively is key to unlocking the full potential of your data.
Effective Methods to Compare Two Columns in Excel for Differences
Excel offers a versatile toolkit for comparing columns to find differences. The best method for you will depend on the specific type of comparison you need to perform and how you want the differences to be highlighted or reported. Here’s a breakdown of effective techniques:
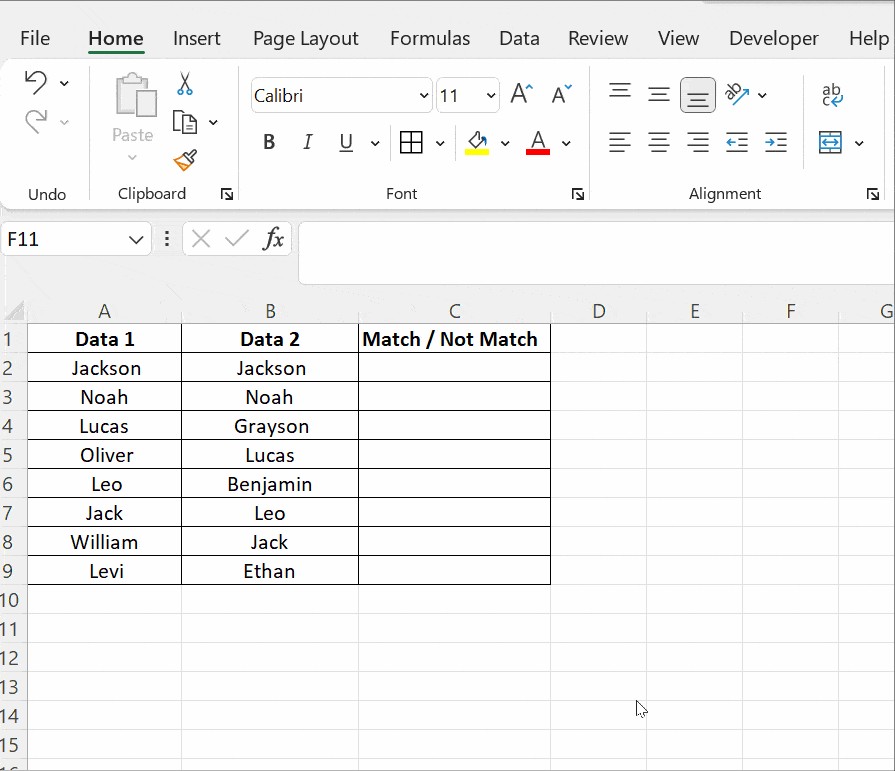
Method 1: The Equals Operator for Quick Row-by-Row Comparison
The simplest method for comparing two columns row by row is using the equals operator (=). This approach is ideal for a basic check of whether corresponding cells in two columns contain identical values.
- In an empty column next to your data (for example, if your columns are A and B, use column C), enter the formula
=A2<>B2in the first cell of the new column (C2, assuming your data starts in row 2). The<>operator means “not equal to”. - Press Enter. The cell will display
TRUEif the values in cells A2 and B2 are different, andFALSEif they are the same. - Drag the fill handle (the small square at the bottom-right of the selected cell) down to apply the formula to the rest of the rows in your data.
Column C will now show TRUE for each row where the values in column A and column B differ, and FALSE where they match. This method provides a quick visual indication of differences across rows.
Method 2: Leveraging the IF Condition to Highlight Differences
For a more descriptive output than TRUE or FALSE, you can use the IF function to display custom messages like “Different” or “Match”.
- In an empty column, enter the formula
=IF(A2<>B2, "Different", "Match")in the first cell. - Press Enter and drag the fill handle down.
This formula checks if cell A2 is not equal to cell B2. If it’s true (they are different), it displays “Different”; otherwise, it displays “Match”. You can customize the text within the quotes to suit your needs, for example, using “Mismatch” or “Discrepancy” instead of “Different”.
To only highlight the differences and leave matching rows blank, you can modify the formula to: =IF(A2<>B2, "Different", ""). This will display “Different” only for rows where columns A and B diverge, leaving the rest of the cells in the comparison column empty.
Method 3: Case-Sensitive Comparison with the EXACT Function
The methods above perform case-insensitive comparisons, meaning “Apple” and “apple” would be considered the same. If you need a case-sensitive comparison, use the EXACT function.
- In an empty column, enter the formula
=IF(EXACT(A2, B2), "Match", "Different")in the first cell. - Press Enter and drag the fill handle down.
The EXACT(text1, text2) function returns TRUE only if text1 and text2 are exactly the same, including case. The IF function then uses this result to display “Match” if they are exactly the same, and “Different” otherwise. This is particularly useful when comparing text data where capitalization is significant, such as product codes or names in a database.
Method 4: Conditional Formatting for Visual Difference Identification
Conditional formatting provides a visually striking way to highlight differences directly within your columns, without adding a separate comparison column.
- Select the two columns you want to compare.
- Go to the Home tab on the Excel ribbon.
- In the Styles group, click Conditional Formatting.
- Select New Rule.
- In the “New Formatting Rule” dialog box, choose “Use a formula to determine which cells to format”.
- In the “Format values where this formula is true” box, enter the formula
=$A2<>$B2(adjust column letters if necessary, keeping the row number relative). Make sure to select the first cell of your data range when referencing columns in the formula (e.g., A2 and B2). - Click the Format button to choose how you want to highlight the different cells (e.g., fill color, font color, border).
- Click OK in both dialog boxes to apply the conditional formatting.
Excel will now highlight cells in both columns where the values in the same row are different, based on the formatting you selected. You can easily see the discrepancies visually within your original data columns.
You can also use conditional formatting to highlight unique or duplicate values within a single column or across two columns.
- Select the columns you want to analyze.
- Go to Home > Conditional Formatting > Highlight Cells Rules > Duplicate Values.
- In the “Duplicate Values” dialog box, choose “Unique” from the dropdown menu to highlight unique entries, or “Duplicate” to highlight matching entries.
- Select your desired formatting style and click OK.
Using “Unique” will highlight values that appear only in one of the selected columns, effectively showing the differences. “Duplicate” can be used to highlight values that are present in both columns, which, while not directly showing differences, can be useful for identifying common entries.
To remove conditional formatting, go to Home > Conditional Formatting > Clear Rules > Clear Rules from Entire Sheet or Clear Rules from Selected Cells.
Method 5: Utilizing VLOOKUP to Identify Missing or Different Data
The VLOOKUP function is powerful for comparing lists and identifying values that are present in one column but missing or different in another. While primarily used for looking up values, it can be adapted for column comparison.
Let’s say you have a “Master List” in column A and a “Sub List” in column B. You want to find out which items in the Master List are not present in the Sub List.
- In an empty column next to your Master List (e.g., column C), enter the formula
=VLOOKUP(A2, $B$2:$B$100, 1, FALSE)in the first cell (adjust$B$2:$B$100to cover the range of your Sub List). TheFALSEargument ensures an exact match is required. - Press Enter and drag the fill handle down.
For each item in column A, VLOOKUP will search for it in column B.
- If an item from column A is found in column B,
VLOOKUPwill return the matching value from column B (in this case, because we setcol_index_numto 1, it returns the item itself). - If an item from column A is not found in column B,
VLOOKUPwill return the#N/Aerror.
The #N/A errors in column C clearly indicate the values from column A that are different in the sense of being absent from column B. You can then filter column C for #N/A errors to isolate the items unique to the Master List.
You can further enhance this by using ISNA function to display a more user-friendly message instead of #N/A: =IF(ISNA(VLOOKUP(A2, $B$2:$B$100, 1, FALSE)), "Not in Sub List", "In Sub List"). This formula will display “Not in Sub List” for items from column A not found in column B, and “In Sub List” for those that are present.
Frequently Asked Questions
1. What is the quickest way to compare two columns in Excel for differences?
For a very quick visual comparison, you can select both columns, then go to Home > Find & Select > Go To Special > Row Differences, and click OK. This will select cells that are different row-by-row. The selected cells will be visually distinct (often gray), while matching cells remain white. However, this method only highlights the cells that are different, not the values themselves in a separate column. For a more detailed analysis, using formulas or conditional formatting is recommended.
2. How can I compare more than two columns for differences in Excel?
When you need to compare multiple columns (more than two) to see if values in the same row are consistent across all columns, you can extend the IF and AND or OR functions.
- To find rows where all columns match: Use the
ANDfunction within anIFformula. For example, to compare columns A, B, and C:=IF(AND(A2=B2, A2=C2), "Full Match", "Different"). This formula will return “Full Match” only if A2, B2, and C2 are all the same. - To find rows where any two columns match: Use the
ORfunction within anIFformula. For example, to check if at least two of columns A, B, and C match:=IF(OR(A2=B2, B2=C2, A2=C2), "Match Found", "No Match"). This formula will return “Match Found” if any pair of cells (A2=B2, B2=C2, or A2=C2) are equal.
You can adapt these formulas for any number of columns by adding more conditions within the AND or OR functions.
3. Is it possible to use INDEX-MATCH to compare columns in Excel for differences?
Yes, while VLOOKUP is commonly used, INDEX-MATCH is a more flexible alternative for column comparison, especially when dealing with more complex scenarios or when you need to retrieve corresponding values from different columns based on matches.
Similar to VLOOKUP, you can use INDEX-MATCH to check if values from one column exist in another. For example, to check if values in column D exist in column A and retrieve a corresponding value from column B if a match is found: =INDEX($B$2:$B$100, MATCH(D2, $A$2:$A$100, 0)). If a value from D2 is found in the range A2:A100, MATCH returns its relative position, and INDEX then returns the value from column B at that position. If no match is found, MATCH (and thus the whole formula) will return #N/A. You can again use ISNA to handle #N/A errors and display custom messages for differences.
Conclusion
Comparing two columns in Excel for differences is a fundamental data analysis task with numerous applications. By mastering the techniques outlined in this guide—from simple operators and IF conditions to conditional formatting and lookup functions like VLOOKUP and INDEX-MATCH—you can significantly enhance your ability to analyze data, identify discrepancies, ensure data quality, and extract valuable insights from your spreadsheets.
Choosing the right method depends on your specific needs and the type of data you are working with. Experiment with these techniques to find the most efficient and effective ways to compare columns in Excel for your data analysis workflows. Further exploration of Excel’s extensive function library and features will continue to empower you to handle increasingly complex data challenges with confidence.