Comparing slopes in regression analysis is crucial for understanding how relationships between variables change under different conditions. This involves determining if the rate of change (slope) of one variable with respect to another is statistically different across various groups or situations. This article explains How To Compare Slopes using visual inspection and statistical tests.
Visual Comparison of Slopes: A First Look
Plotting regression lines on a scatterplot provides a visual way to compare slopes. If the lines have noticeably different steepness, it suggests that the slopes might be different. For instance, imagine comparing the relationship between advertising spend and sales revenue for two different marketing campaigns. If the regression line for campaign A is steeper than campaign B, it indicates that each dollar spent on advertising in campaign A generates a larger increase in sales revenue compared to campaign B. However, visual inspection alone isn’t sufficient. Statistical tests are needed to confirm if the observed difference is due to a real effect or just random variation. The image below demonstrates two distinct slopes; the steeper slope suggests a stronger relationship between the variables.
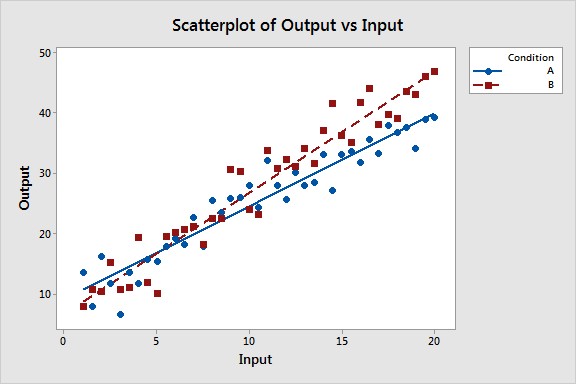 Scatterplot showing two lines with different slopes
Statistically Comparing Slopes: Hypothesis Testing
To determine if the difference in slopes is statistically significant, we use hypothesis testing. This involves comparing the slopes of two or more regression lines to see if they are significantly different from each other. This process utilizes a categorical variable representing the different conditions or groups being compared. By including an interaction term (the product of the continuous predictor and the categorical variable) in the regression model, we can test for differences in slopes.
Understanding Interaction Effects
An interaction effect occurs when the relationship between two variables changes depending on the level of a third variable. In the context of comparing slopes, the interaction term tests whether the slope of the relationship between the independent and dependent variables is different across the categories defined by the categorical variable. A significant interaction term (indicated by a low p-value) signifies a statistically significant difference in slopes. For example, if we are analyzing the impact of fertilizer on crop yield across different soil types, a significant interaction effect would suggest that the effectiveness of fertilizer varies depending on the type of soil.
Implementing the Test in Statistical Software
Statistical software like Minitab simplifies this process. By inputting the data, including the continuous predictor, the dependent variable, and the categorical variable, and specifying the interaction term in the model, the software will perform the analysis. The output will provide a p-value for the interaction term. If the p-value is below a predetermined significance level (e.g., 0.05), we reject the null hypothesis that the slopes are equal and conclude that there is a statistically significant difference in slopes. The coefficient for the interaction term quantifies this difference, indicating how much the slope changes for each level of the categorical variable.
Interpreting the Results
The results of the statistical test will indicate whether the difference in slopes is statistically significant. A significant p-value for the interaction term signifies that the slopes are indeed different. The coefficients for the individual predictors and the interaction term will quantify the relationships. The coefficients for the main effects represent the slopes for the reference category of the categorical variable, while the interaction term coefficient represents the difference in slope for other categories compared to the reference category. Understanding these results provides insights into how the relationships between variables vary across different groups or conditions, leading to more informed conclusions and decision-making.
Conclusion: Beyond Visual Inspection
While visually comparing regression lines provides initial insights, statistically comparing slopes through hypothesis testing and interaction effects is essential for drawing reliable conclusions. Utilizing statistical software simplifies this process, enabling researchers and analysts to confidently determine if observed differences in slopes are statistically significant, ultimately leading to a deeper understanding of the data and the relationships between variables under different conditions.