Understanding how to compare Receiver Operating Characteristic (ROC) curves is crucial for evaluating and selecting the best classification models in various fields, from medical diagnosis to machine learning. ROC curves visually represent the performance of a binary classifier system as its discrimination threshold is varied. This article delves into the methods and considerations for effectively comparing these curves.
Methods for Comparing ROC Curves
Several techniques exist for comparing ROC curves, each offering unique insights into classifier performance:
1. Visual Inspection
A simple initial step involves visually inspecting the plotted ROC curves. A curve closer to the top-left corner of the graph indicates superior performance, reflecting higher true positive rates (sensitivity) at lower false positive rates (1-specificity). Overlapping curves suggest similar performance. However, visual comparisons can be subjective and challenging when differences are subtle.
2. Area Under the Curve (AUC)
The AUC is a widely used metric summarizing the overall performance of a classifier. It represents the probability that the classifier will rank a randomly chosen positive instance higher than a randomly chosen negative one. A higher AUC indicates better performance, with a perfect classifier achieving an AUC of 1.0 and a random classifier scoring 0.5. Comparing AUC values provides a quantitative measure for comparing ROC curves.
3. Partial AUC
While AUC provides a global measure, the partial AUC focuses on a specific region of the ROC curve, reflecting performance within a desired range of false positive rates. This is particularly relevant in applications where certain error types are more critical than others. For instance, in medical diagnosis, minimizing false negatives might be prioritized over minimizing false positives.
4. Confidence Intervals
Calculating confidence intervals for the AUC or partial AUC allows for statistically comparing ROC curves. Non-overlapping confidence intervals indicate a statistically significant difference in performance between classifiers. Various methods exist for computing these confidence intervals, including bootstrapping and DeLong’s method.
5. Statistical Tests
Formal statistical tests can determine if the difference between two or more ROC curves is statistically significant. The DeLong test, for example, is a non-parametric test specifically designed for comparing AUCs. Other tests, like the bootstrap test, can also be employed.
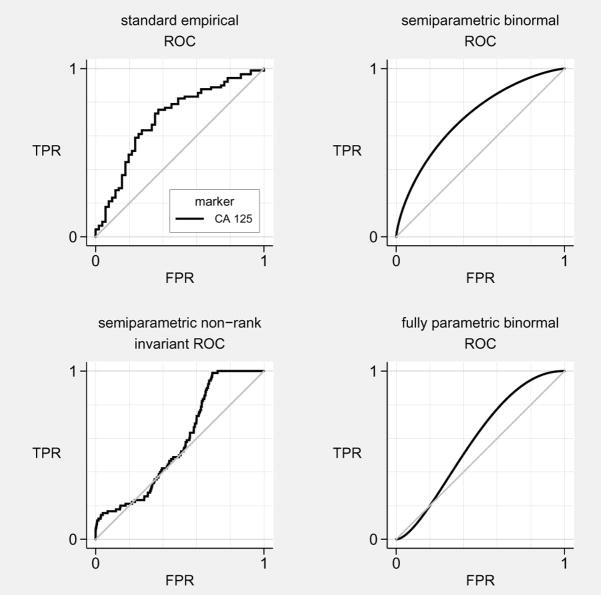 Different ROC Curves and their AUC
Considerations for Comparing ROC Curves
When comparing ROC curves, consider the following factors:
- The specific application: The relative importance of sensitivity and specificity varies depending on the context. Medical diagnosis, spam filtering, and credit scoring all have different performance requirements.
- The cost of different errors: Misclassifications can have varying consequences. Consider the relative costs of false positives and false negatives when interpreting ROC curves.
- The sample size: The reliability of ROC curve comparisons depends on the sample size used to generate the curves. Larger sample sizes generally lead to more stable and reliable estimates.
- The chosen methodology: The method used for comparing ROC curves (visual inspection, AUC, statistical tests) should align with the specific research question and data characteristics.
Conclusion
Comparing ROC curves is essential for evaluating and selecting optimal classification models. Employing a combination of visual inspection, AUC analysis, partial AUC, confidence intervals, and statistical tests provides a comprehensive understanding of classifier performance. By considering the specific application, error costs, sample size, and chosen methodology, researchers can make informed decisions based on robust comparisons of ROC curves. Choosing the right method for comparison hinges on understanding the specific needs of the problem and the desired level of rigor in the analysis.