When analyzing data in SPSS, comparing frequencies across different categories is a common task. While the Frequencies procedure is a go-to for generating frequency tables, it has a limitation: it omits categories with zero counts. This can be misleading, especially when comparing groups or analyzing survey data where the absence of a response is meaningful. This article explains how to overcome this limitation and ensure accurate frequency comparisons using the Custom Tables procedure in SPSS.
The Problem with the Frequencies Procedure
The Frequencies procedure automatically excludes categories with zero frequencies. While this might seem helpful for cleaning up output, it can misrepresent the data. For instance, in a survey with a 5-point Likert scale, if no one selects “Strongly Disagree,” the Frequencies procedure won’t display that category. This could lead to the incorrect interpretation that the option wasn’t even presented to respondents.
Comparing Frequencies with Custom Tables
The solution is to use the Custom Tables procedure. This feature, available in SPSS Statistics Standard and Premium, allows you to include all categories, even those with zero counts, ensuring a comprehensive comparison of frequencies.
Steps to Compare Frequencies using Custom Tables:
-
Access Custom Tables: Navigate to Analyze > Tables > Custom Tables.
-
Define Row Variable: Drag and drop the variable you want to analyze into the “Rows” section.
-
Include Totals (Optional): Click “Categories and Totals” and check the “Totals” box to add a row summarizing the counts. You can also include missing values here.
-
Add Percentages (Optional): Click “Summary Statistics,” expand “Table Percent,” and select the desired percentage types (Table N %, Table Valid N %, Table Total N %). Click “Apply to Selection” then “Close.” Understanding the differences between these percentages is crucial for accurate interpretation.
-
Generate the Table: Click “OK” to run the procedure.
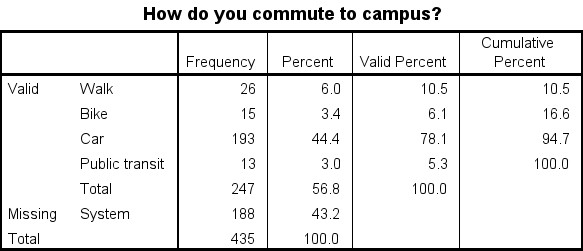
Understanding the Output
The Custom Tables output will display all defined categories, including those with zero frequencies, allowing for a true comparison. You’ll see the counts for each category. If you opted for percentages, you’ll have additional columns showing the proportion of each category relative to the total count, valid count, or total number of cases in the dataset.
Using Syntax for Custom Tables
For more advanced users, SPSS syntax offers greater control over table creation. The article provides syntax examples for generating tables with various combinations of counts, percentages, and totals. You can copy and paste this syntax directly into the SPSS syntax editor for quick and reproducible results.
Conclusion
Accurate frequency comparison is essential for meaningful data analysis. By leveraging the Custom Tables procedure in SPSS, you can overcome the limitations of the Frequencies procedure and ensure that all categories are represented, leading to a more accurate and comprehensive understanding of your data. This method is particularly important when dealing with survey data, Likert scales, and multiple-choice questions where zero counts hold significant meaning.