Comparing digital cameras can be overwhelming with so many models and specifications. However, understanding key technical aspects like resolution and chromatic aberration can significantly simplify the process. This guide outlines a practical method to compare digital camera image quality using freely available resources.
While comparing images online often proves unreliable due to low resolution, websites like DPReview.com offer a valuable resource: standardized resolution chart images. These images, captured under consistent conditions across various camera models, allow for objective comparisons.
Technical image quality encompasses several factors, but resolution and chromatic aberration are often prioritized. Utilizing DPReview’s image library, we can effectively measure these aspects. Let’s compare a few camera models (selected for demonstration purposes) using their converted raw resolution chart images from DPReview.
Comparing Camera Resolution and Chromatic Aberration
Step-by-Step Procedure:
-
Download Resolution Chart Images: Locate and download the full-size resolution chart images for your chosen cameras from the “Resolution” section of their respective DPReview reviews. For example, you might compare a Canon EOS Rebel T8i to a Sony a7 III.
-
Utilize QuickMTF Software: Download QuickMTF, a free tool offering a limited number of free measurements, from Quickmtf.com. This software employs the ISO standard for measuring resolution based on the SFR (Spatial Frequency Response) slant edge method, ensuring accurate and consistent results.
-
Analyze Images in QuickMTF: Open each downloaded image in QuickMTF. You’ll observe several slanted edges at various angles on the chart. Select one edge for analysis.
-
Select and Measure: Using the cursor tool, draw a rectangle enclosing a portion of the slanted edge. This action generates an MTF (Modulation Transfer Function) curve graph displaying information such as line pairs per picture height, a measure of resolution.
-
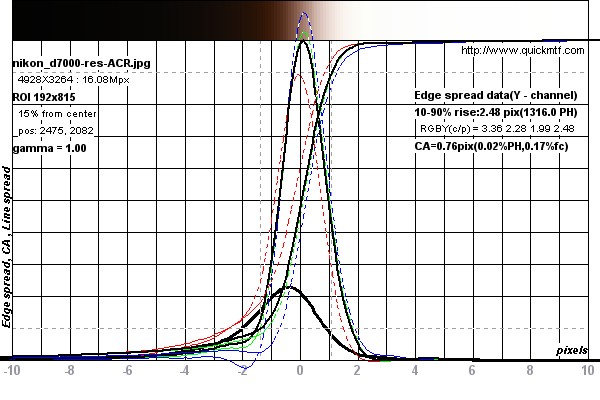
Evaluate Edge Spread and Chromatic Aberration: Click the “Edge Spread” and “Line Spread” buttons in the toolbar to visualize these functions. These graphs allow you to determine edge blur (a measure of sharpness) and chromatic aberration (color fringing). Lower values for edge blur and chromatic aberration indicate better performance.
Interpreting the Results
Analyzing the MTF, Edge Spread, and Line Spread graphs provides valuable insights into image quality. For instance, “ringing” in the graphs might indicate sharpening applied to the image, which can skew resolution measurements. Ideally, images should be unsharpened for accurate comparison. Here’s a sample table showcasing results from a previous comparison:
| Camera Model | Edge Blur (pixels) | Chromatic Aberration (pixels) |
|---|---|---|
| Nikon D7000 | 2.5 | 0.8 |
| Nikon D5100 | 2.6 | 0.6 |
| Nikon D3100 | 2.1 | 0.7 |
| Canon 600D | 2.4 | 0.6 |
| Panasonic DMC-G2 | 2.0 | 0.2 |
(Note: For reference, 1.27 pixels represents the theoretically best achievable result for edge blur.)
Conclusion
By following this methodology, you can objectively compare the resolution and chromatic aberration of different digital cameras. Remember to consider other factors like ISO performance, dynamic range, and autofocus capabilities for a comprehensive evaluation. While this technical approach provides crucial data, understanding your specific photography needs remains paramount when choosing the right camera. 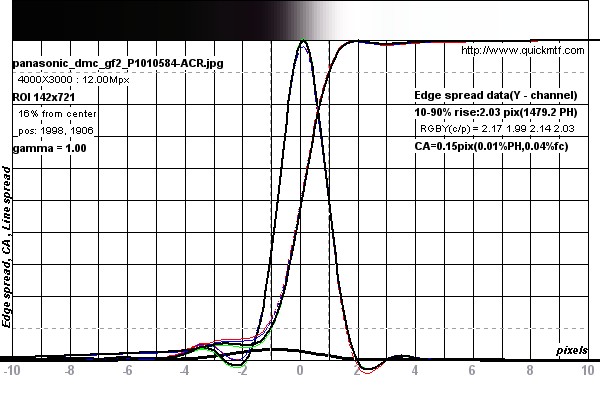 Panasonic DMC-GF2 Results Finally, the Panasonic DMC-GF2 results are displayed, illustrating a different performance profile compared to the other cameras analyzed.