Comparing averages is a fundamental aspect of statistical analysis, allowing researchers to draw meaningful conclusions from data. This guide explores various methods for comparing averages, ranging from basic t-tests to more complex techniques like mixed models. Understanding these methods empowers researchers to select the most appropriate test for their specific research question.
Choosing the Right Method for Comparing Averages
The choice of method depends on several factors, including the number of groups being compared, the nature of the data, and the research question. Here’s a breakdown of common techniques:
T-Tests for Comparing Two Groups
T-tests are powerful tools for comparing the means of two groups. Different types of t-tests address specific scenarios:
- One-Sample T-Test: Compares a sample mean to a known population mean.
- Paired T-Test: Compares means from two related samples (e.g., pre- and post-test scores).
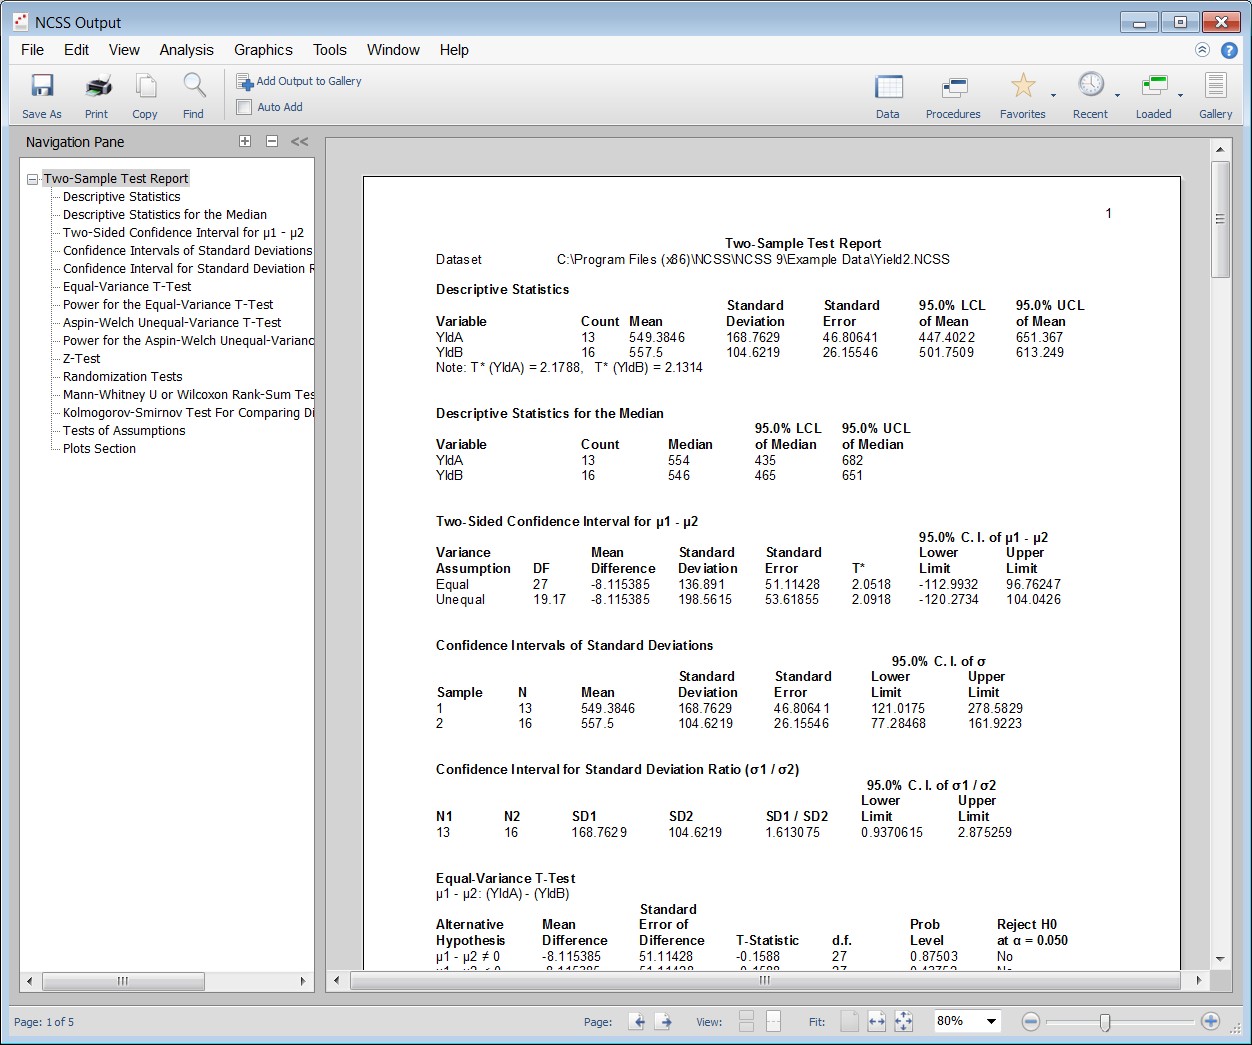
- Two-Sample T-Test: Compares means from two independent groups.
Beyond p-values, t-tests provide confidence intervals, effect size estimates, and can incorporate non-parametric alternatives like the Mann-Whitney test for non-normal data.
ANOVA for Comparing Three or More Groups
Analysis of Variance (ANOVA) extends the principles of t-tests to compare means across three or more groups.
- One-Way ANOVA: Examines differences among multiple groups based on a single factor.
- Repeated Measures ANOVA: Analyzes data where measurements are taken on the same subjects multiple times.
Post-hoc tests, such as Tukey’s HSD or Bonferroni correction, help pinpoint specific group differences after a significant ANOVA result. Non-parametric alternatives include the Kruskal-Wallis test.
Advanced Techniques: General Linear Models and Mixed Models
- General Linear Models (GLM): Provide a flexible framework for analyzing complex experimental designs with multiple factors and covariates, including interactions and nested effects. GLM encompasses ANOVA and regression as special cases.
- Mixed Models: Further extend GLM to handle both fixed and random effects, making them suitable for analyzing hierarchical data structures and longitudinal studies with missing data. Mixed models accommodate variations in time points and allow for more realistic modeling of covariance structures.
Considerations for Comparing Averages
- Assumptions: Most parametric tests, like t-tests and ANOVA, assume normally distributed data and equal variances across groups. Violations of these assumptions may require transformations or non-parametric alternatives.
- Multiple Comparisons: When comparing multiple groups, adjusting for multiple comparisons is crucial to control the overall error rate.
Conclusion
Choosing the correct method for comparing averages is essential for accurate data analysis. This guide provides an overview of commonly used statistical techniques, highlighting their strengths and applications. By understanding the nuances of each method, researchers can confidently analyze data and draw meaningful conclusions from their findings. Software packages like NCSS offer comprehensive tools for implementing these methods and visualizing results.