Are you curious about how your net worth stacks up against your peers? It’s a natural question, and this article provides data-driven insights to help you understand where you stand in the wealth distribution. We’ll explore net worth percentiles and averages across different age groups, using data from a Federal Reserve survey. This analysis will also delve into the role of home equity in overall net worth.
Understanding Net Worth Percentiles by Age
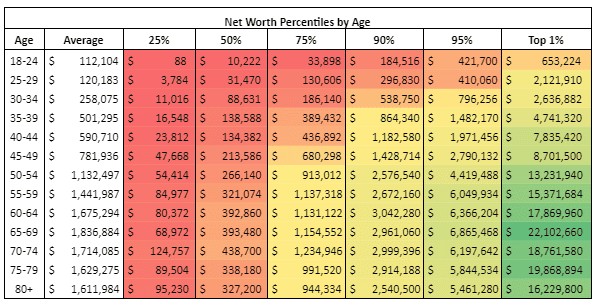
The data reveals significant differences in net worth across various age groups and percentiles. The table below showcases average and median net worth alongside key percentile markers (25th, 50th, 75th, 90th, 95th, and 99th) for each age bracket. Note that the average net worth is typically higher than the median due to the influence of high-net-worth individuals.
For instance, a 37-year-old with a $900,000 net worth would fall between the 90th and 95th percentile for their age group.
The following graph highlights the disparity between average and median net worth, peaking in the late 60s for the average and early 70s for the median.
Analyzing the 25th, 50th, and 75th percentiles reveals a widening gap as wealth increases, reflecting growing economic inequality.
The 90th percentile remains relatively stable between the early 50s and 80s, hovering around $2.5 to $3 million. However, the 99th percentile, representing the top 1%, exhibits a sharp increase, peaking at over $22 million in the late 60s.
Investable Net Worth: Excluding Home Equity
While home equity contributes significantly to total net worth, it’s essential to consider investable net worth, which excludes home equity to provide a clearer picture of liquid assets. This metric is particularly relevant for assessing potential investment returns.
As expected, investable net worth figures are considerably lower than total net worth across all percentiles. The disparity between the 50th and 75th percentile widens further when considering investable assets.
The Role of Home Equity in Net Worth
Analyzing the difference between total and investable net worth reveals the impact of home equity across various age groups and wealth levels.
Home equity constitutes a significant portion of net worth for lower percentiles, often exceeding 50%. However, its relative importance diminishes as net worth increases. For the top 1%, home equity represents a much smaller fraction of overall wealth.
Home Equity as a Percentage of Net Worth
Examining home equity as a percentage of net worth further emphasizes its diminishing role in overall wealth as net worth grows.
For the wealthiest individuals, home equity may represent as little as 4% of their total net worth.
Conclusion
Comparing your net worth to others can provide a benchmark, but it’s crucial to avoid unhealthy comparisons. Focus on your own financial goals and consult with a financial professional to develop a personalized plan that aligns with your individual circumstances. While understanding where you stand relative to others can be informative, true financial success lies in achieving your personal financial objectives. This analysis of net worth data offers valuable context for evaluating your own financial progress and making informed decisions about your future.