GMI (Glucose Management Indicator) is a metric derived from continuous glucose monitoring (CGM) data, providing an estimate of average blood glucose levels. It’s often compared to A1C, a standard measure of long-term blood sugar control. But how exactly does GMI compare to A1C, and why is this comparison important for diabetes management?
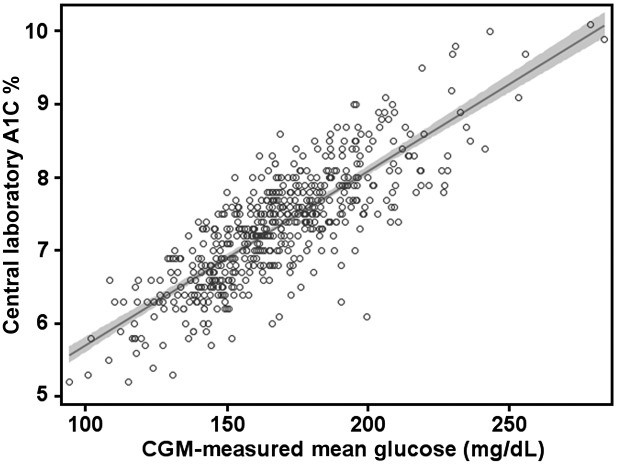 alt text: Graph comparing CGM-measured mean glucose concentration vs. central laboratory A1C
Understanding the Differences Between GMI and A1C
While both GMI and A1C reflect blood glucose levels, they differ significantly in how they’re measured and what they represent:
- A1C: Measures the percentage of hemoglobin (a protein in red blood cells) that’s glycated (coated with sugar). It provides an average blood glucose level over the past 2-3 months, reflecting the lifespan of red blood cells. A1C is a well-established marker for long-term diabetes complications.
- GMI: Calculated using a formula based on average glucose levels obtained from CGM data, typically over 10-14 days. GMI offers a more immediate picture of glucose control, reflecting recent glucose trends. It was previously referred to as “estimated A1C” (eA1C), but the name was changed to avoid confusion.
Why the Shift from eA1C to GMI?
The term eA1C often led to misunderstandings, as it implied a direct correlation with laboratory-measured A1C. However, several factors can cause discrepancies between eA1C and A1C, including individual variations in red blood cell lifespan and glycation rates. To address this, the FDA advocated for a name change, resulting in the adoption of “Glucose Management Indicator” (GMI). GMI aims to provide a clearer picture of current glucose management without suggesting a precise match with A1C.
Calculating GMI and Interpreting the Results
GMI is calculated using the following formula derived from clinical trials using accurate CGM systems:
GMI (%) = 3.31 + 0.02392 × [mean glucose in mg/dL]
GMI (mmol/mol) = 12.71 + 4.70587 × [mean glucose in mmol/L]
Generally, a 25 mg/dL increase in mean glucose corresponds to a 0.6% increase in GMI. For instance, a mean glucose of 150 mg/dL equates to a GMI of 6.9%.
Using GMI and A1C Together for Optimal Diabetes Management
Both GMI and A1C play crucial roles in effective diabetes management. While A1C provides a long-term overview and assesses the risk of complications, GMI offers a more immediate assessment of glucose control, allowing for timely adjustments to treatment plans.
CGM data, along with GMI, reveals valuable insights into glucose variability, time spent in target range, and hypo/hyperglycemia episodes, which A1C alone cannot capture. This comprehensive information allows for personalized treatment strategies. For example, a lower-than-expected GMI compared to A1C might indicate a need to adjust medication or lifestyle to avoid hypoglycemia. Conversely, a higher GMI might suggest the need for tighter glucose control to prevent hyperglycemia.
Conclusion
GMI and A1C are complementary tools in diabetes management. Understanding their differences and how to interpret them together is crucial for effective glucose control and reducing the risk of long-term complications. As CGM technology becomes more widely adopted, GMI will likely play an increasingly significant role in personalized diabetes care. Consult with your healthcare provider to understand how GMI and A1C can be used together to optimize your diabetes management plan.