Wealthy nations generally invest more in healthcare compared to lower-income countries. However, the United States stands out even among high-income countries for its significantly higher healthcare expenditure. This analysis delves into how U.S. health spending compares to other large, wealthy nations within the OECD (Organisation for Economic Co-operation and Development), focusing on countries with similar economic profiles based on GDP and GDP per capita.
The U.S. Leads in Health Expenditure Relative to Economic Size
While a country’s wealth often correlates with its healthcare spending, the U.S. allocates a disproportionately large share of its economy to health compared to its peers. To provide a meaningful comparison, we examine OECD countries with above-median national incomes and above-median income per person, ensuring a focus on nations with comparable economic capacity.
Per Capita Health Spending in the U.S. Dwarfs Other Wealthy Nations
In 2022, the U.S. spent $12,555 per person on healthcare, exceeding every other high-income nation by over $4,000. The average health expenditure per capita in comparable countries was approximately $6,651—roughly half the U.S. figure. This substantial difference underscores the unique position of the U.S. in global healthcare spending.
Health Spending Increased Across Peer Nations in 2022, Including the U.S.
Between 2021 and 2022, most comparable nations witnessed an increase in per capita health spending. The U.S. experienced a 2.9% rise, a moderate increase compared to many peers, though greater than Australia (2.4%), Canada (0.7%), and the United Kingdom (0.5%). Belgium recorded the most significant surge at 9.6%. It’s worth noting that the U.S.’s 2.9% increase is slightly above the 2.4% increase from 2020 to 2021 but considerably lower than the 9.8% jump from 2019 to 2020, which was heavily influenced by the onset of the COVID-19 pandemic.
U.S. Health Spending as a GDP Percentage Decreased in 2022, Yet Remains High
Over the past half-century, the gap in health spending as a percentage of GDP between the U.S. and other OECD countries has widened. In 1970, the U.S. allocated around 6.2% of its GDP to health, similar to other wealthy nations (average of 4.9%). However, starting in the 1980s, U.S. health spending grew at a much faster pace relative to its GDP compared to peer countries.
The COVID-19 pandemic in 2020 caused a spike in health spending as a share of GDP in the U.S. and comparable countries due to increased healthcare needs and economic contraction. In the U.S., this share rose to 18.8% in 2020 from 16.7% in 2019. As economies recovered, this percentage decreased to 17.4% in 2021 and further to 16.6% in 2022. Despite these recent declines, the U.S.’s health spending as a GDP percentage remains significantly higher than other comparable nations.
Pre-Pandemic, U.S. Health Spending Growth Slightly Outpaced Peer Nations
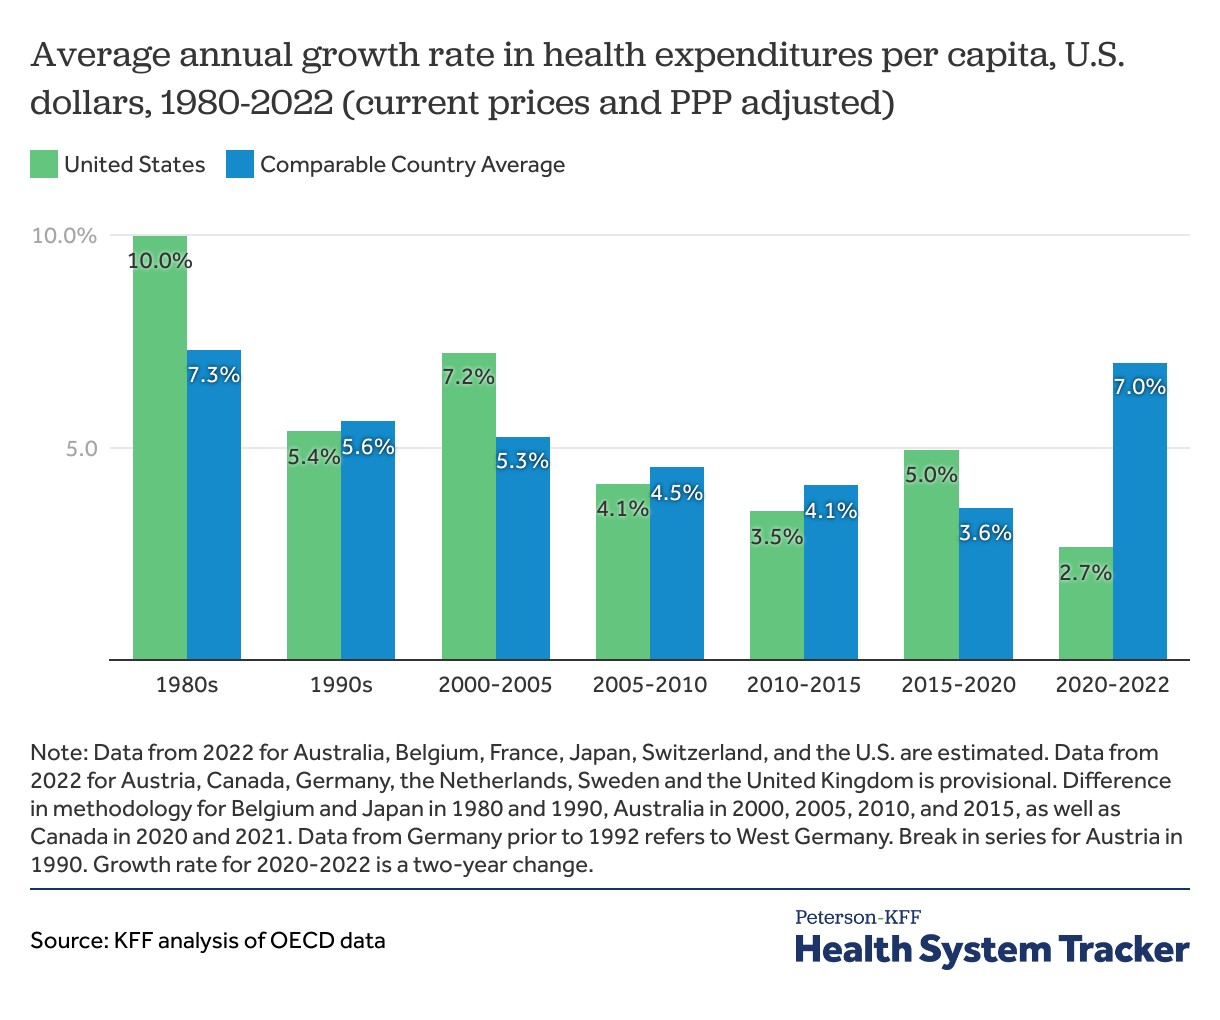
Historically, the 1980s marked a period of rapid growth in U.S. per capita health expenditures, with a 10.0% average annual growth rate, substantially higher than the 7.3% average in comparable countries. In more recent periods, from 2005-2010, the U.S. saw a slower average annual growth rate of 4.1% (compared to 7.2% in the preceding five years), mirroring a slowdown in comparable countries as well (4.5% from 5.3%).
In the five years leading up to the pandemic (2015-2020), the U.S. experienced a 5.0% average annual growth in health spending per capita, exceeding the 3.6% average of comparable nations. Interestingly, between 2020 and 2022, the annual growth rate for comparable countries increased to 7.0%, while the U.S. saw a smaller increase of 2.7% during the same period, indicating a potential shift in comparative spending growth patterns.
In Conclusion
The data consistently shows that the United States spends considerably more on healthcare than other large, wealthy nations, both per person and as a proportion of its economy. While recent years have seen some shifts in growth rates and spending as a percentage of GDP, the U.S. remains a significant outlier in terms of healthcare expenditure compared to its international peers.