Venn diagrams are powerful visual tools perfect for helping kids understand comparisons. They clearly illustrate similarities and differences between subjects, making learning engaging and effective. Using PowerPoint, you can easily create these diagrams. This guide will show you how to use free PowerPoint Venn diagram templates and create your own from scratch, making comparison learning fun and accessible for children.
Venn diagrams use overlapping circles to show relationships between different ideas or objects. The overlapping parts highlight what’s similar, while the separate parts show what’s different. This visual representation is incredibly helpful for kids to grasp complex concepts in a simple way.
Why Venn Diagrams are Great for Kids’ Learning
Venn diagrams are more than just circles; they are fantastic educational tools for children because:
- Visual Learning: Kids are often visual learners. Venn diagrams present information visually, making it easier to understand and remember comparisons than just reading text.
- Simplifies Complexity: Breaking down complex topics into similarities and differences using a visual diagram simplifies the learning process.
- Critical Thinking Skills: Creating and interpreting Venn diagrams encourages critical thinking and analytical skills as children identify and categorize information.
- Versatile Tool: From comparing animals to contrasting story characters, Venn diagrams can be used across various subjects like science, literature, history, and even math.
- Engaging & Interactive: Creating Venn diagrams can be an interactive activity, keeping kids engaged and making learning more enjoyable.
Free PowerPoint Venn Diagram Templates for Kids
Instead of starting from a blank slide, using a template can save time and effort. Luckily, PowerPoint offers built-in SmartArt features that include Venn diagram layouts. These are essentially free templates right within PowerPoint!
Here’s how to access them:
- Open PowerPoint.
- Go to the Insert tab on the ribbon.
- In the Illustrations group, click on SmartArt.
- In the Choose a SmartArt Graphic window, select Relationship.
- You’ll see various Venn diagram layouts like Basic Venn, Linear Venn, and Stacked Venn. Choose Basic Venn to start with, as it’s straightforward for kids.
- Click OK.
A basic Venn diagram with three circles will appear on your slide, ready for customization.
How to Create a Venn Diagram in PowerPoint: A Kid-Friendly Guide
Creating a Venn diagram in PowerPoint is simple, even for beginners. Follow these easy steps to guide your kids:
Adding Text to the Circles
Each circle represents a topic you are comparing. Adding text labels is crucial.
- Select a Circle: Click on any circle within your SmartArt graphic.
- Add Text:
- Using the Text Pane: Look for the Text Pane, usually on the left side of your SmartArt. If you don’t see it, click the arrow control on the edge of the SmartArt graphic to open it. In the Text pane, click on [Text] next to each circle shape and type in your label.
- Directly on the Circle: Alternatively, you can directly click inside a circle in the Venn diagram and start typing your label.
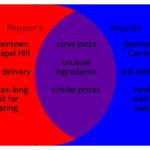
For example, if you’re comparing cats and dogs, label one circle “Cats” and another “Dogs”.
Adding Text to the Overlapping Portions
The overlapping areas are where you list the similarities between the topics. PowerPoint doesn’t directly allow text input into these overlapping sections via the Text Pane in Venn diagrams. Instead, you’ll use text boxes:
- Go to Insert Tab: Click on the Insert tab again.
- Insert Text Box: In the Text group, click Text Box, then select Draw Text Box.
- Draw Text Box: Click and drag to draw a text box over an overlapping section of the circles.
- Add Text: Click inside the text box and type in the similarities. For example, for cats and dogs, similarities could be “Pets,” “Have Fur,” “Need Food.”
- Format Text Box (Optional): To make the text box blend in:
- Right-click on the text box and select Format Shape.
- In the Format Shape pane, under Fill, choose No fill to remove the white background.
- Under Line, choose No line to remove the border.
Adding More Circles
Sometimes you might want to compare more than two topics. Adding circles is easy:
- Select a Circle: Click on any existing circle in your Venn diagram.
- Add Shape: Under SmartArt Tools, you’ll see a Design tab appear in the ribbon. In the Create Graphic group, click the arrow next to Add Shape.
- Choose Add Position:
- Add Shape After: Adds a circle after the selected one, overlapping it.
- Add Shape Before: Adds a circle before the selected one, overlapping it.
- Experiment with both to see which placement works best for your diagram.
Customizing Colors and Styles for Kids
Make Venn diagrams visually appealing and fun for kids by changing colors and styles:
- Select SmartArt: Click on your entire Venn diagram to select it.
- Change Colors: Under SmartArt Tools -> Design tab, in the SmartArt Styles group, click Change Colors. Choose from various color schemes. Brighter, contrasting colors can be more engaging for children.
- SmartArt Styles: Explore different styles in the SmartArt Styles box for visual effects like 3D or outlines. Click the More button for even more options.
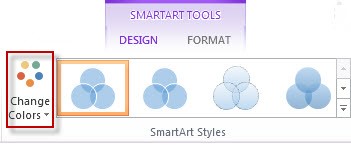 Change Colors option in the SmartArt Styles group
You can also customize individual circle colors and line styles by right-clicking on a circle and selecting Format Shape. Experiment with Fill colors and Line styles to create a visually stimulating Venn diagram.
Using Venn Diagrams in the Classroom or at Home
Venn diagrams are incredibly versatile. Here are some ideas for using them with kids:
- Compare Animals: Cats vs. Dogs, Mammals vs. Reptiles, Birds vs. Insects.
- Compare Books or Stories: Compare two characters, settings, or plot points from different books.
- Compare Fruits and Vegetables: Sweet fruits vs. Savory vegetables, Fruits with seeds vs. Fruits with pits.
- Compare Transportation Methods: Cars vs. Bikes, Trains vs. Airplanes.
- Compare Shapes: Squares vs. Circles, Cubes vs. Spheres.
Encourage kids to brainstorm the topics and features to compare. Let them participate in creating the Venn diagram in PowerPoint. This hands-on approach will reinforce their understanding and make learning more impactful.
Conclusion
Venn diagrams are a fantastic, free, and readily available tool in PowerPoint for teaching comparison skills to kids. By using free templates and customizing them to be visually appealing, you can make learning engaging and effective. So, start using PowerPoint Venn diagrams to unlock your kids’ comparing power and make learning fun!