The melting point of a substance provides valuable insights into both its identity and purity. Impurities significantly influence a compound’s melting point, typically causing a broader and lower melting range compared to a pure sample. Even slight deviations in the melting point range can be significant.
 alt text: A melting point apparatus with a sample tube inserted.
How Impurities Affect Melting Point
Pure substances exhibit a sharp melting point, occurring over a narrow temperature range. However, the presence of impurities disrupts the crystal lattice structure, weakening the intermolecular forces holding the molecules together. This disruption requires less energy to break the bonds, resulting in a lower melting point. The impurities also cause a wider melting range due to the non-uniform distribution within the sample. A broader and depressed melting point range directly correlates with a decrease in purity.
Verifying Purity with a Control Sample
To accurately assess purity using melting point, comparing the isolated compound to a known pure sample (control) under identical conditions is crucial. A difference exceeding 1°C usually indicates unacceptable purity. This comparison helps eliminate variations due to the melting point apparatus itself. Slight inconsistencies in the equipment can lead to deviations from literature values even for pure samples.
Combining Melting Point with Other Analytical Techniques
Melting point determination rarely stands alone in purity assessment. Other techniques, such as infrared (IR) spectroscopy, often complement it. Discrepancies in one analysis should correlate with findings from other methods. For instance, a depressed melting point often corresponds to unexpected peaks in the IR spectrum, indicating impurities. However, impurities must generate strong signals in distinct regions of the IR spectrum for clear detection.
Case Study: 2-Naphthol Recrystallization
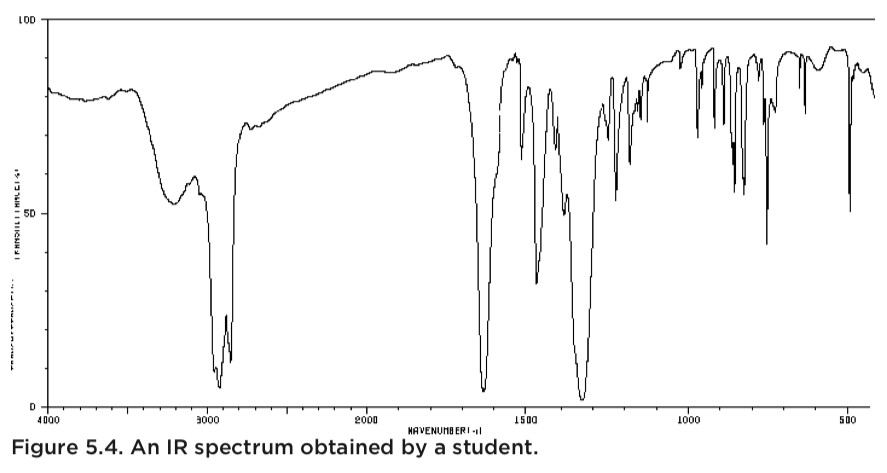
Consider a student recrystallizing 2-naphthol from ethyl acetate. The literature melting point for 2-naphthol is 121-123 °C. However, the student’s sample melted at 115-121 °C, a lower and broader range. This discrepancy clearly indicates impurities.
The student’s IR spectrum revealed an OH peak (around 3200 cm-1), expected for 2-naphthol. However, it also showed a C=O peak, suggesting residual ethyl acetate from the recrystallization process, likely due to insufficient drying. Combining the lower melting point with the unexpected C=O peak in the IR spectrum pinpointed the impurity and its source.
Conclusion: Melting Point and Purity Percentage
Melting point analysis serves as a valuable tool for assessing the purity of a compound. A sharp melting point over a narrow range signifies high purity, while a broader and depressed melting range suggests the presence of impurities. Combining melting point data with other analytical techniques like IR spectroscopy provides a more comprehensive understanding of sample purity and allows for identification of potential contaminants. While a direct correlation between a specific percentage of impurity and the degree of melting point depression is complex and not always straightforward, a deviation from the expected melting point clearly signals that the sample is not pure.