Google Trends is a valuable tool for identifying trending keywords and understanding search interest over time. However, a common question arises: does Google Trends show actual search numbers or just relative popularity? Understanding this distinction is crucial for accurate keyword research and informed decision-making.
Decoding Google Trends’ Search Volume Data
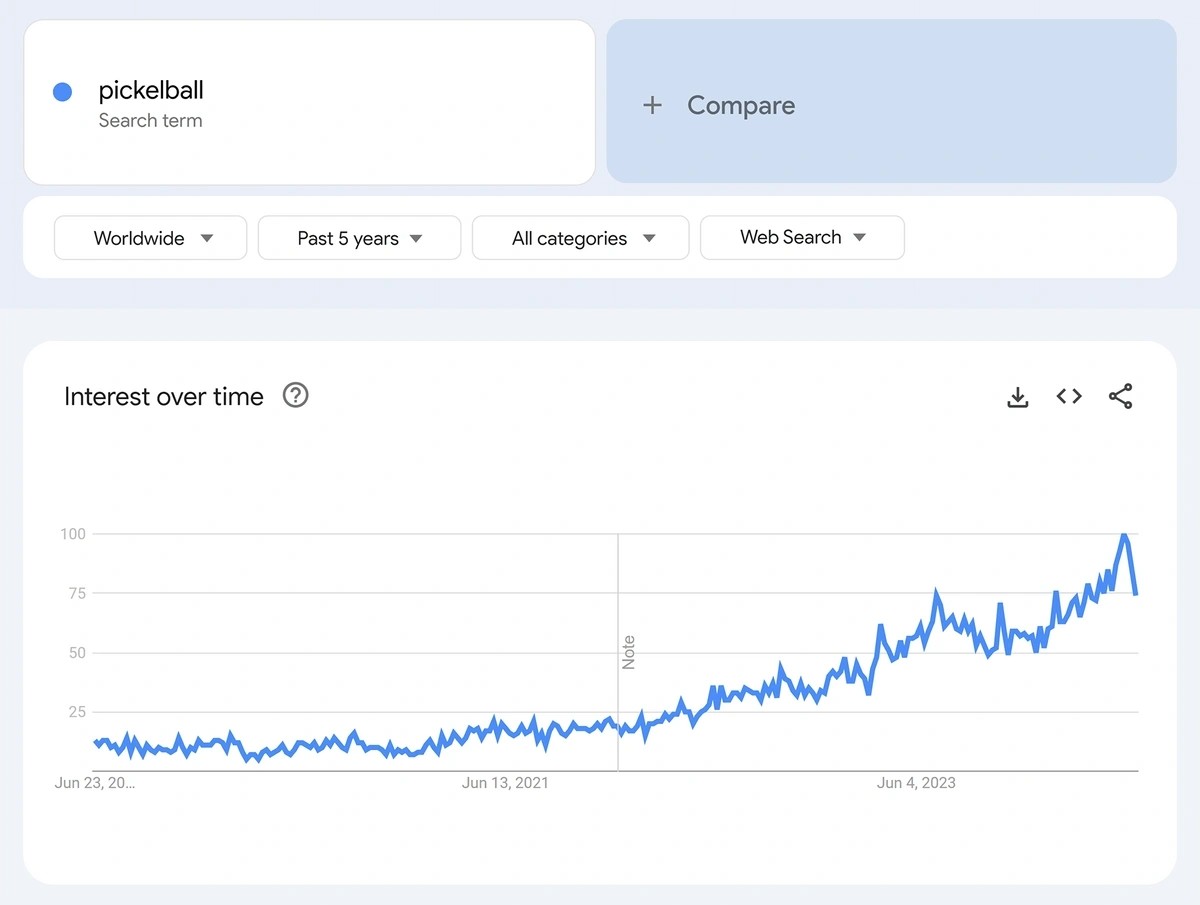
When you input a keyword into Google Trends, you’re presented with an “interest over time” graph. This graph displays a score ranging from 0 to 100 along the vertical axis, representing search interest relative to the highest point for that term within the selected timeframe. The horizontal axis represents the time period. A score of 100 signifies peak popularity, while 0 indicates minimal or no search interest.
Crucially, these numbers do not represent actual search volume. Google Trends provides a relative popularity score, not the absolute number of searches. For instance, a score of 50 doesn’t mean 50 searches; it means the keyword’s popularity is half of its peak popularity during the specified period.
This relative index is calculated by normalizing search data, dividing each data point by the highest point in the dataset and multiplying by 100. This allows for comparison of search interest across different time periods and locations, even for keywords with vastly different search volumes.
The Meaning of “Breakout” in Google Trends
Google Trends also highlights “breakout” keywords or topics, signifying a substantial surge in search interest, often over 5,000%. However, similar to the overall trend data, this “breakout” label reflects relative growth, not specific search counts. While it indicates a significant increase in popularity, it doesn’t reveal the actual number of searches driving that growth.
Why Relative Popularity Matters
Despite not providing absolute search volume, Google Trends’ relative data offers valuable insights:
- Identifying Trending Topics: Spotting rising search interest helps uncover emerging trends and capitalize on growing market demand.
- Comparing Keyword Popularity: Analyzing relative popularity allows you to compare search interest for different keywords and identify which terms are more frequently searched.
- Understanding Seasonal Trends: Observing fluctuations in search interest over time reveals seasonal patterns and informs content planning and marketing strategies.
The Need for Absolute Search Volume Data
While Google Trends is excellent for understanding relative popularity, knowing the actual search volume is crucial for data-driven decisions. This requires tools that provide absolute search volume data, enabling more precise keyword targeting and forecasting potential traffic. These tools offer concrete numbers, empowering informed decisions about content creation, advertising campaigns, and overall SEO strategy. Combining relative trend data from Google Trends with absolute search volume from other SEO tools provides a comprehensive understanding of keyword performance.
Conclusion
Google Trends provides valuable insights into keyword popularity and trends by comparing relative search interest, not actual search counts. Understanding this distinction is crucial for leveraging the platform effectively. While Google Trends highlights relative popularity and identifies “breakout” trends, integrating data from tools that provide absolute search volume is essential for comprehensive keyword research and informed decision-making. By combining both relative and absolute data, you gain a complete picture of keyword performance and can make more strategic decisions for your content and marketing efforts.