Data visualization is especially useful for comparing data, enabling clear insights and informed decisions. COMPARE.EDU.VN offers extensive resources to help you choose the most effective chart type for your specific data comparison needs, ensuring you present information clearly and persuasively. Understanding the strengths and weaknesses of various data visualization techniques is crucial for effective data analysis and presentation, ensuring you choose the best method for your comparison.
1. Bar Charts: Comparing Categorical Data Magnitudes
Bar charts excel at comparing magnitudes across different categories. These charts use rectangular bars to represent data values, where the length or height of each bar is proportional to the value it represents.
1.1 Vertical Bar Charts (Column Charts)
Vertical bar charts, also known as column charts, are commonly used to display data where the categories are arranged horizontally along the x-axis and the values are represented vertically along the y-axis.
Usage: Ideal for comparing the sales figures of different products, website traffic from various sources, or survey responses across different demographic groups.
1.2 Horizontal Bar Charts
Horizontal bar charts present data with the categories on the y-axis and the values on the x-axis. They are particularly useful when category labels are long or when dealing with ranked categories.
Usage: Effective for displaying survey results with detailed response options or comparing the performance of different departments within a company, where department names might be lengthy.
1.3 Multi-Set Bar Charts (Grouped Bar Charts)
Multi-set bar charts, also known as grouped bar charts, allow for comparing multiple categories segmented by another variable. This type of chart displays bars grouped together for each category, with each bar representing a different sub-category.
Usage: Useful for comparing sales performance of different products across multiple regions or analyzing survey responses from different age groups for several questions.
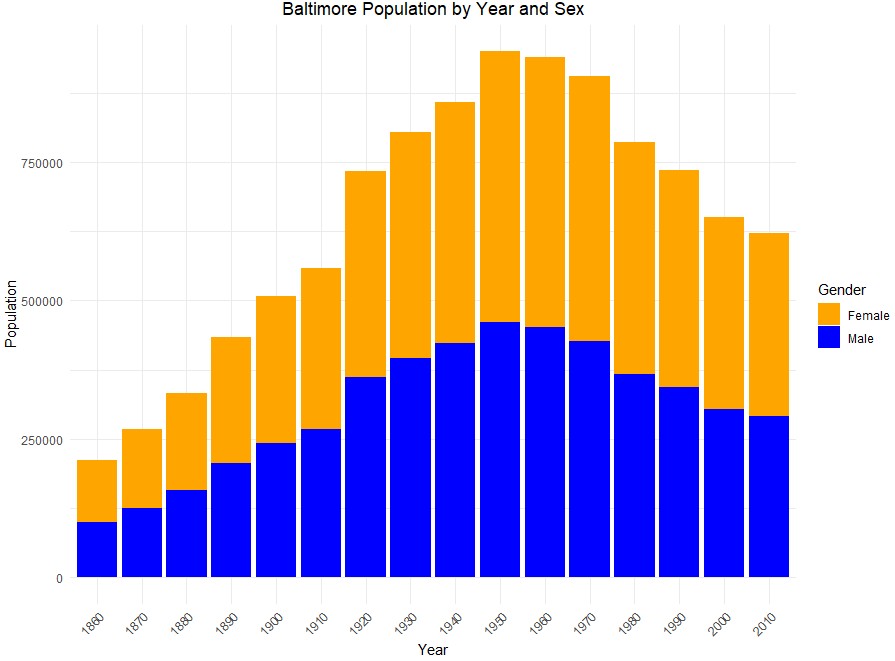
1.4 Stacked Bar Charts
Stacked bar charts are used to compare the composition of different categories. Each bar represents a total value, and it is divided into segments that represent the contribution of each sub-category to the total.
Usage: Ideal for showing the market share of different companies in a specific industry or displaying the composition of a project budget, breaking down expenses by category.
2. Bubble Charts: Visualizing Three-Dimensional Data
Bubble charts are a type of scatter plot used to compare three-dimensional data. Two values are represented by the x and y axes, and a third value is represented by the size of the bubble.
Usage: Suitable for comparing products based on price, features, and customer satisfaction or analyzing countries based on GDP, population, and life expectancy.
3. Bullet Graphs: Comparing Performance Measures
A bullet graph is primarily used for comparing a performance measure against one or more related measures. It consists of a feature measure (the main value), a comparative measure (the target), and qualitative ranges (performance context).
Usage: Effective for tracking sales performance against targets, monitoring website traffic compared to previous periods, or evaluating employee performance against set goals.
4. Heat Maps: Visualizing Data with Color Gradients
Heat maps are used to visualize and compare three continuous or categorical variables. They organize observations in a matrix, using color gradients to represent the magnitude of the third variable.
Usage: Heat maps are especially useful for comparing ordered data that ranges in sequences such as time or temperature, etc. They can be used to visualize website traffic patterns by time of day and day of week, correlation matrices in finance, or gene expression levels in biology.
5. Line Graphs: Analyzing Continuous Trends Over Time
Line charts are useful for comparing continuous trends, most often over time. The line graph is a Cartesian coordinate plot chart with the points being connected to indicate the order of the trend and illustrate more clearly the changes in magnitude between one observation and the next.
Usage: Ideal for tracking stock prices over time, monitoring temperature changes, or analyzing website traffic trends.
6. Marimekko Charts: Visualizing Data Across Three Dimensions
The Marimekko chart, also known as a Mekko chart, is designed to visualize data across three dimensions. These dimensions can encompass a blend of either two numeric and one categorical variable or two categorical and one numeric variable.
Usage: Mekko charts excel at comparing categorical data, especially when the number of categories is limited. When the x-axis is a numeric variable like a percentage, the widths of the column can be varied to represent proportion. It can be used to analyze market segmentation based on customer demographics and product preferences or display sales data by region and product category.
7. Nightingale Rose Charts: Representing Directional Data
This chart is sometimes mistakenly called a radial bar chart and is similar to the Radial Column Chart, both of which see below.
Usage: The Nightingale Rose chart can be used to visualize data such as wind direction, geographical orientations, periodic or cyclical data representing time of day, month or year, etc, or sequential data where the sequence can be logically ordered around the circularity of the graph.
8. Parallel Coordinates Plots: Visualizing Multi-Dimensional Data
Parallel coordinates plots are used to visualize multi-dimensional data, where each dimension is represented as a vertical axis, and data points are connected across these axes.
Usage: Effective for identifying patterns and clusters in complex datasets, such as analyzing customer behavior across multiple attributes or visualizing financial data with several indicators.
9. Population Pyramids: Representing Demographic Variables
Population pyramids are used to represent and compare typically two demographic variables, one numeric and one categorical, for a specific time. Population pyramids are most often seen in visualizations of age by sex.
Usage: A third variable can be incorporated with gradient shading of the individual population cohorts (e.g. females aged 45-50, and average income). Population pyramids are useful for demographic analysis, visualizing age and gender distribution, and comparing population structures between different regions or time periods.
10. Radar Charts: Comparing Multiple Quantitative Variables
Radar charts are used to compare multiple quantitative variables for different categories. Each variable is represented as an axis radiating from the center, and data points are plotted along these axes.
Usage: Suitable for comparing the features of different products, evaluating the performance of different employees across multiple skills, or analyzing the characteristics of different customer segments.
11. Radial Bar Charts: Representing Directional Data
Radial bar charts are useful for representing directional data where the value is represented at the compass degree position such as wind direction or other geographical orientations; periodic or cyclical data representing time of day month or year, etc, or sequential data where the sequence can be logically ordered around the circularity of the graph.
Usage: The radial column chart is more compact than the bar chart and is useful for highlighting differences in values, especially when visualized with a polar grid. This chart is very similar in appearance to the Nightingale Rose Chart (which, see).
12. Radial Column Charts: Representing Cyclical Data
Radial column charts are useful for representing cyclical data, where the value is represented around a circle. Each category is displayed as a column radiating from the center.
Usage: Effective for visualizing data related to time of day, months of the year, or other cyclical patterns. It can be used to display sales performance by month, website traffic by hour of the day, or seasonal temperature variations.
13. Span Charts: Highlighting Durations and Ranges
The Span chart is useful for highlighting and comparing durations and ranges. While it is arguably most often used for representing time durations, it can also be used for visualizing the range of values between minimum and maximum levels across various categories or groups.
Usage: This visualization can be illustrative in scenarios where understanding the extent and overlap of ranges is important. The span chart can also be oriented vertically. The span chart is also known as Range chart, Floating bar chart, Difference chart, High-Low chart.
14. Stacked Area Graphs: Comparing Part-to-Whole Relationships
Stacked area charts are used to compare part to whole relationships. Each layer in a stacked area chart represents a variable and the area of the layer represents the variable’s total value.
Usage: The x-axis typically represents a continuous or interval variable like time, and the y-axis represents both the cumulative total of all variables and the individual value of specific variables. This chart is useful for comparing relative proportions of individual variables to each other and to the total value of the dataset, where all values are positive. Stacked area charts can be used to display the composition of a company’s revenue by product line over time or show the distribution of energy sources in a country’s energy mix.
15. Word Clouds: Visualizing Word Frequency
Word clouds are used to visualize a collection of words and shows their frequency by size and/or color.
Usage: Word clouds are useful for analyzing text data, identifying the most frequent terms, and gaining insights into the main themes. They can be used to visualize customer feedback, analyze social media data, or summarize the content of documents.
16. Advanced Visualization Techniques
Beyond the standard chart types, several advanced visualization techniques can be employed to compare data effectively:
16.1 Treemaps
Treemaps display hierarchical data as a set of nested rectangles, where the size of each rectangle is proportional to its value.
Usage: Treemaps are useful for visualizing the composition of a portfolio, showing the breakdown of a budget, or analyzing website traffic by different sections.
16.2 Sankey Diagrams
Sankey diagrams visualize the flow of data between different categories, with the width of the links representing the quantity of flow.
Usage: Effective for showing the flow of energy in a system, visualizing the movement of funds in a financial transaction, or analyzing website user behavior.
16.3 Network Graphs
Network graphs display relationships between entities as nodes connected by edges, with the position and size of nodes and the thickness of edges indicating the strength of the relationships.
Usage: Useful for visualizing social networks, analyzing supply chain relationships, or mapping connections in a knowledge graph.
17. Data Visualization Tools and Software
Several tools and software platforms are available to create data visualizations, each offering different features and capabilities:
17.1 Tableau
Tableau is a powerful data visualization tool that allows users to create interactive dashboards and reports.
Features: Drag-and-drop interface, wide range of chart types, data blending, and real-time data analysis.
17.2 Power BI
Power BI is a business analytics tool by Microsoft that provides interactive visualizations and business intelligence capabilities.
Features: Data connectivity to various sources, intuitive dashboard design, and integration with other Microsoft products.
17.3 Python (with Libraries like Matplotlib and Seaborn)
Python offers powerful libraries like Matplotlib and Seaborn for creating custom data visualizations.
Features: Flexibility in chart design, statistical plotting, and integration with data analysis workflows.
17.4 R (with Libraries like ggplot2)
R provides libraries like ggplot2 for creating high-quality graphics and statistical visualizations.
Features: Customizable plots, extensive statistical analysis tools, and publication-ready graphics.
18. Best Practices for Effective Data Comparison
To ensure your data comparisons are effective and insightful, follow these best practices:
18.1 Choose the Right Chart Type
Select the chart type that best fits your data and the message you want to convey. Consider the type of data (categorical, continuous, hierarchical) and the relationships you want to highlight.
18.2 Keep It Simple and Clear
Avoid clutter and unnecessary complexity in your visualizations. Use clear labels, concise titles, and a consistent color scheme.
18.3 Use Color Effectively
Use color to highlight important data points and create visual contrast. Avoid using too many colors, as it can be distracting.
18.4 Provide Context
Include labels, annotations, and legends to provide context for your data. Explain the meaning of the axes, units, and any abbreviations used.
18.5 Ensure Accessibility
Design your visualizations to be accessible to all users, including those with visual impairments. Use high contrast colors, provide alternative text for images, and ensure compatibility with screen readers.
19. Case Studies: Successful Data Comparison Examples
19.1 Comparing Sales Performance Across Regions
A retail company uses a multi-set bar chart to compare sales performance across different regions for various product categories. This allows them to identify top-performing regions and product lines, as well as areas needing improvement.
19.2 Analyzing Customer Satisfaction Scores
A customer service department uses a line graph to track customer satisfaction scores over time. This helps them identify trends, assess the impact of service improvements, and monitor customer sentiment.
19.3 Visualizing Website Traffic Patterns
A marketing team uses a heat map to visualize website traffic patterns by time of day and day of week. This allows them to identify peak traffic times, optimize content scheduling, and improve user engagement.
20. Common Mistakes to Avoid in Data Visualization
20.1 Using the Wrong Chart Type
Selecting an inappropriate chart type can obscure your data and lead to misinterpretations. For example, using a pie chart to compare multiple categories with similar values can be confusing.
20.2 Overloading the Visualization
Adding too much information to a single visualization can make it difficult to understand. Avoid cluttering your charts with unnecessary labels, annotations, and colors.
20.3 Misleading the Audience
Using misleading scales, truncating axes, or manipulating colors can distort your data and mislead your audience. Always present your data honestly and transparently.
20.4 Ignoring Accessibility
Failing to design your visualizations for accessibility can exclude a significant portion of your audience. Ensure your charts are accessible to users with visual impairments by using high contrast colors and providing alternative text for images.
21. The Future of Data Visualization
The field of data visualization is constantly evolving, with new tools, techniques, and technologies emerging. Some key trends shaping the future of data visualization include:
21.1 Interactive Visualizations
Interactive visualizations allow users to explore data in more detail, zoom in on specific areas, and filter data based on their interests.
21.2 Augmented Reality (AR) and Virtual Reality (VR)
AR and VR technologies are being used to create immersive data visualization experiences, allowing users to interact with data in a more intuitive and engaging way.
21.3 Artificial Intelligence (AI) and Machine Learning (ML)
AI and ML algorithms are being used to automate the process of data visualization, identify patterns and insights, and generate personalized visualizations for individual users.
22. Enhance Your Data Comparison Skills with COMPARE.EDU.VN
Choosing the right data visualization is essential for clear and persuasive communication. Understanding which chart type is especially useful for comparing data will give you the edge you need. COMPARE.EDU.VN offers comprehensive resources to help you master data visualization techniques.
22.1 COMPARE.EDU.VN: Your Partner in Data Visualization
COMPARE.EDU.VN provides detailed guides, tutorials, and examples to help you choose the most effective chart type for your specific data comparison needs. Whether you’re comparing products, services, or ideas, COMPARE.EDU.VN equips you with the knowledge to present your information clearly and persuasively.
22.2 Explore a Variety of Data Visualizations
From bar charts and line graphs to heat maps and scatter plots, COMPARE.EDU.VN covers a wide range of data visualization techniques. Each technique is explained with clear examples, demonstrating how to use them effectively for different types of comparisons.
22.3 Learn How to Compare Data Effectively
COMPARE.EDU.VN offers expert advice on how to compare data effectively, highlighting the strengths and weaknesses of various chart types. Learn how to choose the best visualization to highlight key trends, patterns, and insights in your data.
22.4 Make Informed Decisions with Data Visualization
Data visualization is a powerful tool for decision-making. With COMPARE.EDU.VN, you can learn how to use data visualization to make informed decisions, solve problems, and drive business success.
23. Why Data Visualization Is Especially Useful for Comparing Data
Data visualization transforms complex data into easily understandable visual formats. When it comes to comparing data, the right visualization can highlight differences, trends, and patterns that might be missed in raw data tables. This makes data visualization especially useful for:
23.1 Identifying Key Trends
Visualizations like line graphs and bar charts make it easy to spot trends over time or across categories, enabling quick identification of areas that need attention.
23.2 Spotting Outliers
Scatter plots and box plots can quickly reveal outliers or anomalies in your data, helping you identify unusual observations that warrant further investigation.
23.3 Comparing Performance
Bar charts, bullet graphs, and radar charts are excellent for comparing the performance of different products, services, or departments, providing a clear view of relative strengths and weaknesses.
23.4 Understanding Relationships
Scatter plots, heat maps, and network graphs can help you understand the relationships between different variables, revealing correlations and dependencies that might not be obvious from raw data.
23.5 Communicating Insights
Well-designed visualizations are a powerful way to communicate insights to a broader audience, making complex data more accessible and engaging.
24. How to Choose the Right Data Visualization
Choosing the right data visualization depends on the type of data you’re working with and the message you want to convey. Here are some factors to consider:
24.1 Type of Data
- Categorical Data: Use bar charts, pie charts, or treemaps to compare categories.
- Continuous Data: Use line graphs, scatter plots, or histograms to show trends and distributions.
- Hierarchical Data: Use treemaps or sunburst charts to display nested categories.
- Geospatial Data: Use maps or choropleth maps to visualize data across geographic regions.
24.2 Goal of Visualization
- Comparison: Use bar charts, line graphs, or scatter plots to compare values across categories or over time.
- Composition: Use pie charts, stacked bar charts, or area charts to show the parts of a whole.
- Distribution: Use histograms, box plots, or density plots to show the distribution of a single variable.
- Relationship: Use scatter plots, heat maps, or network graphs to explore the relationships between variables.
24.3 Audience
Consider the knowledge level and preferences of your audience when choosing a visualization. Keep it simple and clear, and use familiar chart types that are easy to understand.
25. Frequently Asked Questions (FAQ)
Q1: What is the most commonly used data visualization chart for comparisons?
A: Bar charts and line graphs are the most commonly used charts for comparisons due to their simplicity and effectiveness in showing differences and trends.
Q2: How can I compare multiple sets of data in one chart?
A: You can use multi-set bar charts, grouped bar charts, or line graphs with multiple lines to compare multiple sets of data in one chart.
Q3: What is the best chart for comparing parts of a whole?
A: Pie charts, stacked bar charts, and area charts are best for comparing parts of a whole.
Q4: How can I visualize relationships between variables?
A: Scatter plots, heat maps, and network graphs are useful for visualizing relationships between variables.
Q5: What is the difference between a bar chart and a histogram?
A: A bar chart compares categorical data, while a histogram shows the distribution of continuous data.
Q6: How can I make my data visualizations more accessible?
A: Use high contrast colors, provide alternative text for images, and ensure compatibility with screen readers.
Q7: What are some common mistakes to avoid in data visualization?
A: Avoid using the wrong chart type, overloading the visualization, misleading the audience, and ignoring accessibility.
Q8: What is Tableau and how can it help with data visualization?
A: Tableau is a data visualization tool that allows users to create interactive dashboards and reports. It offers a drag-and-drop interface, a wide range of chart types, and real-time data analysis capabilities.
Q9: How can I use Python for data visualization?
A: Python offers powerful libraries like Matplotlib and Seaborn for creating custom data visualizations. These libraries provide flexibility in chart design, statistical plotting, and integration with data analysis workflows.
Q10: What are some emerging trends in data visualization?
A: Some emerging trends include interactive visualizations, augmented reality (AR) and virtual reality (VR), and artificial intelligence (AI) and machine learning (ML).
26. Ready to Elevate Your Data Comparisons?
Don’t let complex data overwhelm you. Visit COMPARE.EDU.VN today and discover the perfect data visualization chart for your needs. With our comprehensive resources and expert guidance, you’ll be able to make informed decisions and communicate your insights with clarity and confidence.
For more information and expert assistance, contact us:
Address: 333 Comparison Plaza, Choice City, CA 90210, United States
Whatsapp: +1 (626) 555-9090
Website: COMPARE.EDU.VN
Take control of your data and start making smarter decisions today with compare.edu.vn.