Choosing the right statistical test when comparing three groups can be tricky, but COMPARE.EDU.VN simplifies the process for you. Selecting an appropriate test, such as ANOVA, ensures your analysis is accurate and meaningful, especially when dealing with multiple comparisons, hypothesis testing, and understanding statistical significance. Let’s dive into a comprehensive guide to help you make the best choice, whether you’re dealing with normally distributed data or non-parametric scenarios, including considerations for effect size and post-hoc analysis.
1. Why Can’t I Just Use Multiple T-Tests?
Performing multiple t-tests to compare three or more groups inflates the risk of a Type I error, also known as a false positive. Each t-test has a set significance level (alpha, usually 0.05), meaning there’s a 5% chance of incorrectly rejecting the null hypothesis. When you conduct multiple t-tests, these probabilities accumulate, leading to a much higher overall chance of finding a significant difference when none actually exists. This issue is well-documented in statistical literature and can lead to misleading conclusions. Instead, methods like ANOVA or non-parametric alternatives, coupled with post-hoc tests, are more appropriate as they control for this inflated error rate. According to a study by the University of California, performing multiple t-tests significantly increases the likelihood of making a Type I error.
2. What is ANOVA and When Should I Use It?
Analysis of Variance (ANOVA) is a statistical test used to compare the means of two or more groups. It’s particularly useful when you want to determine if there is a statistically significant difference between the means of three or more independent groups. The core principle of ANOVA is to analyze the variance within each group and compare it to the variance between the groups.
2.1. Assumptions of ANOVA
ANOVA relies on several key assumptions:
- Normality: The data within each group should be approximately normally distributed.
- Homogeneity of Variance: The variance within each group should be roughly equal.
- Independence: The observations within each group should be independent of each other.
2.2. How ANOVA Works
ANOVA partitions the total variance in the data into different sources: variance between groups and variance within groups. The test statistic, known as the F-statistic, is calculated as the ratio of the variance between groups to the variance within groups. A large F-statistic suggests that there are significant differences between the group means.
2.3. When to Use ANOVA
Use ANOVA when:
- You have three or more independent groups to compare.
- You want to determine if there is a significant difference in the means of these groups.
- Your data meets the assumptions of normality, homogeneity of variance, and independence.
3. What Are the Different Types of ANOVA?
There are several types of ANOVA, each designed for different experimental designs and data structures. The most common types include:
3.1. One-Way ANOVA
One-way ANOVA is used when you have one independent variable (factor) with three or more levels (groups). For example, you might use a one-way ANOVA to compare the effectiveness of three different teaching methods on student test scores.
3.2. Two-Way ANOVA
Two-way ANOVA is used when you have two independent variables (factors) and want to examine their main effects and interaction effects on a dependent variable. For example, you might use a two-way ANOVA to study the effects of both diet and exercise on weight loss.
3.3. Repeated Measures ANOVA
Repeated Measures ANOVA is used when you have repeated measurements on the same subjects under different conditions. This is often used in longitudinal studies or experiments where you want to track changes over time.
4. What is the F-Statistic, and How is it Interpreted?
The F-statistic is the test statistic used in ANOVA. It represents the ratio of the variance between groups to the variance within groups. A larger F-statistic indicates that the differences between group means are more substantial relative to the variability within each group.
4.1. Calculation of the F-Statistic
The F-statistic is calculated as:
F = MSB / MSW
Where:
- MSB = Mean Square Between groups
- MSW = Mean Square Within groups
4.2. Interpretation of the F-Statistic
To interpret the F-statistic, you compare it to a critical value from the F-distribution, based on the degrees of freedom and the chosen significance level (alpha). If the calculated F-statistic exceeds the critical value, you reject the null hypothesis and conclude that there are significant differences between the group means.
5. What Happens After ANOVA If I Find a Significant Result?
If ANOVA reveals a significant overall difference between the group means, it doesn’t tell you which specific groups are different from each other. To determine which groups differ significantly, you need to perform post-hoc tests.
5.1. Post-Hoc Tests
Post-hoc tests are pairwise comparisons that control for the inflated risk of Type I error associated with multiple comparisons. Several post-hoc tests are available, each with its own strengths and weaknesses.
5.2. Common Post-Hoc Tests
- Tukey’s Honestly Significant Difference (HSD): Controls for the familywise error rate and is suitable when all pairwise comparisons are of interest.
- Bonferroni Correction: A conservative method that adjusts the significance level for each comparison to maintain the overall alpha level.
- Scheffé’s Method: The most conservative post-hoc test, suitable when you have complex comparisons beyond pairwise comparisons.
- Dunnett’s Test: Used when comparing multiple treatment groups to a single control group.
5.3. How to Choose the Right Post-Hoc Test
The choice of post-hoc test depends on the specific research question and the characteristics of the data. Tukey’s HSD is often a good starting point for pairwise comparisons. If you have a specific control group, Dunnett’s test may be more appropriate.
6. What If My Data Isn’t Normally Distributed?
If your data does not meet the assumption of normality, you may need to use non-parametric tests. Non-parametric tests do not rely on assumptions about the distribution of the data.
6.1. Kruskal-Wallis Test
The Kruskal-Wallis test is a non-parametric alternative to one-way ANOVA. It is used to compare the medians of three or more independent groups. The Kruskal-Wallis test ranks all the data points across all groups and then compares the sum of the ranks for each group.
6.2. When to Use Kruskal-Wallis
Use the Kruskal-Wallis test when:
- You have three or more independent groups to compare.
- Your data does not meet the assumption of normality.
- You want to determine if there is a significant difference in the medians of these groups.
6.3. Post-Hoc Tests for Kruskal-Wallis
If the Kruskal-Wallis test reveals a significant overall difference, you can perform post-hoc tests to determine which specific groups are different from each other. Common post-hoc tests for Kruskal-Wallis include the Dunn’s test and the Bonferroni correction.
7. What About Comparing Paired or Dependent Samples?
When you have paired or dependent samples (e.g., measurements taken on the same subjects under different conditions), you need to use different statistical tests that account for the correlation between the samples.
7.1. Repeated Measures ANOVA
Repeated Measures ANOVA is used when you have repeated measurements on the same subjects under different conditions and your data meets the assumptions of normality and homogeneity of variance.
7.2. Friedman Test
The Friedman test is a non-parametric alternative to repeated measures ANOVA. It is used when you have repeated measurements on the same subjects under different conditions and your data does not meet the assumption of normality.
7.3. When to Use Friedman Test
Use the Friedman test when:
- You have repeated measurements on the same subjects under different conditions.
- Your data does not meet the assumption of normality.
- You want to determine if there is a significant difference in the medians of these related groups.
8. How Do I Account for Unequal Variances?
If your data violates the assumption of homogeneity of variance (i.e., the variances of the groups are not equal), you may need to use alternative statistical tests or adjustments.
8.1. Welch’s ANOVA
Welch’s ANOVA is a robust alternative to one-way ANOVA that does not assume equal variances. It adjusts the degrees of freedom to account for the unequal variances.
8.2. When to Use Welch’s ANOVA
Use Welch’s ANOVA when:
- You have three or more independent groups to compare.
- Your data violates the assumption of homogeneity of variance.
- You want to determine if there is a significant difference in the means of these groups.
8.3. Post-Hoc Tests for Welch’s ANOVA
After Welch’s ANOVA, you can use post-hoc tests such as the Games-Howell test to determine which specific groups are different from each other.
9. What Role Does Effect Size Play?
Effect size measures the magnitude of the difference between groups. While statistical significance tells you whether the difference is likely to be due to chance, effect size tells you how practically significant the difference is.
9.1. Common Effect Size Measures
- Cohen’s d: Measures the standardized difference between two means.
- Eta-squared (η²): Measures the proportion of variance in the dependent variable that is explained by the independent variable in ANOVA.
- Omega-squared (ω²): A less biased estimator of the proportion of variance explained.
9.2. Interpretation of Effect Size
- Small Effect: Cohen’s d ≈ 0.2, η² ≈ 0.01, ω² ≈ 0.01
- Medium Effect: Cohen’s d ≈ 0.5, η² ≈ 0.06, ω² ≈ 0.06
- Large Effect: Cohen’s d ≈ 0.8, η² ≈ 0.14, ω² ≈ 0.14
9.3. Why Effect Size Matters
Reporting effect size alongside p-values provides a more complete picture of the research findings. A statistically significant result with a small effect size may not be practically meaningful, while a non-significant result with a large effect size may warrant further investigation.
10. How Do I Report the Results of These Tests?
Reporting the results of statistical tests accurately and completely is essential for transparency and reproducibility.
10.1. Reporting ANOVA Results
When reporting ANOVA results, include the following information:
- The F-statistic
- The degrees of freedom for the numerator and denominator
- The p-value
- The effect size (e.g., η² or ω²)
- A brief interpretation of the findings
Example:
“A one-way ANOVA revealed a significant difference in test scores between the three teaching methods, F(2, 47) = 5.43, p = 0.007, η² = 0.19. Post-hoc tests using Tukey’s HSD indicated that Method A resulted in significantly higher test scores than Method B (p < 0.05).”
10.2. Reporting Kruskal-Wallis Results
When reporting Kruskal-Wallis results, include the following information:
- The Kruskal-Wallis H-statistic
- The degrees of freedom
- The p-value
- A brief interpretation of the findings
Example:
“A Kruskal-Wallis test revealed a significant difference in job satisfaction levels between the three departments, H(2) = 7.82, p = 0.020. Post-hoc tests using Dunn’s test with Bonferroni correction indicated that Department C had significantly higher job satisfaction levels than Department A (p < 0.05).”
10.3. Reporting Welch’s ANOVA Results
When reporting Welch’s ANOVA results, include the following information:
- The Welch’s F-statistic
- The degrees of freedom for the numerator and denominator
- The p-value
- A brief interpretation of the findings
Example:
“Welch’s ANOVA revealed a significant difference in income levels between the three cities, F(2, 28.5) = 6.15, p = 0.006. Post-hoc tests using Games-Howell indicated that City X had significantly higher income levels than City Y (p < 0.05).”
11. What Are Some Real-World Examples of These Tests?
To illustrate the application of these statistical tests, consider the following real-world examples:
11.1. Example 1: Comparing the Effectiveness of Different Drugs
A pharmaceutical company wants to compare the effectiveness of three different drugs in treating hypertension. They randomly assign patients to one of the three drug groups and measure their blood pressure after six weeks. A one-way ANOVA can be used to determine if there is a significant difference in blood pressure reduction between the three drugs.
11.2. Example 2: Assessing Customer Satisfaction in Different Departments
A retail company wants to assess customer satisfaction levels in three different departments (e.g., clothing, electronics, and home goods). They collect customer satisfaction ratings on a scale of 1 to 10. A Kruskal-Wallis test can be used to determine if there is a significant difference in customer satisfaction levels between the three departments.
11.3. Example 3: Evaluating the Impact of Training Programs
An organization wants to evaluate the impact of two different training programs on employee performance. They measure employee performance before and after each training program. A repeated measures ANOVA can be used to determine if there is a significant improvement in employee performance after each training program.
12. How Can Statistical Software Help?
Statistical software packages can greatly simplify the process of conducting these statistical tests and interpreting the results.
12.1. Popular Statistical Software
- SPSS: A widely used statistical software package with a user-friendly interface.
- R: A free and open-source statistical programming language.
- SAS: A comprehensive statistical software package often used in business and research.
- Excel: While not a dedicated statistical software package, Excel can perform basic statistical analyses.
12.2. Conducting ANOVA in SPSS
To conduct ANOVA in SPSS:
- Enter your data into SPSS.
- Go to Analyze > Compare Means > One-Way ANOVA.
- Specify the dependent variable and the independent variable.
- Select post-hoc tests if needed.
- Run the analysis and interpret the results.
12.3. Conducting Kruskal-Wallis in SPSS
To conduct Kruskal-Wallis in SPSS:
- Enter your data into SPSS.
- Go to Analyze > Nonparametric Tests > Legacy Dialogs > K Independent Samples.
- Specify the dependent variable and the independent variable.
- Run the analysis and interpret the results.
13. What Are Some Common Pitfalls to Avoid?
When conducting statistical tests, it’s essential to avoid common pitfalls that can lead to incorrect conclusions.
13.1. Violating Assumptions
Ensure that your data meets the assumptions of the statistical test you are using. Violating assumptions can lead to inaccurate results.
13.2. Data Dredging
Avoid “data dredging” or “p-hacking,” which involves repeatedly analyzing your data in different ways until you find a statistically significant result. This can lead to false positives.
13.3. Overinterpreting Results
Don’t overinterpret statistical results. Statistical significance does not necessarily imply practical significance.
13.4. Ignoring Effect Size
Always report effect size alongside p-values to provide a more complete picture of your findings.
14. Are There Any Alternatives to ANOVA and Kruskal-Wallis?
Yes, depending on the nature of your data and research question, other statistical tests may be appropriate.
14.1. Analysis of Covariance (ANCOVA)
ANCOVA is used to compare the means of two or more groups while controlling for the effects of one or more continuous covariates. For example, if you’re comparing the effectiveness of three different teaching methods, you might use ANCOVA to control for students’ prior academic performance.
14.2. Multivariate Analysis of Variance (MANOVA)
MANOVA is used to compare the means of two or more groups on multiple dependent variables simultaneously. For example, if you’re comparing the effects of three different diets, you might use MANOVA to examine their impact on both weight loss and cholesterol levels.
14.3. Mixed Models
Mixed models are used to analyze data with both fixed and random effects. They are particularly useful for longitudinal data or data with hierarchical structures.
15. How To Determine The Sample Size Needed?
Determining an adequate sample size is crucial for ensuring the statistical power of your analysis. An underpowered study may fail to detect real effects, while an overpowered study wastes resources.
15.1 Power Analysis
A power analysis is a statistical method used to estimate the minimum sample size required to detect an effect of a given size with a specified level of confidence. Key components of a power analysis include:
- Effect Size: The magnitude of the difference you want to detect.
- Significance Level (α): The probability of making a Type I error (usually set at 0.05).
- Power (1 – β): The probability of detecting a real effect (usually set at 0.80).
15.2 Conducting a Power Analysis
Power analyses can be conducted using statistical software such as G*Power, R, or SAS. These tools allow you to input your desired effect size, significance level, and power, and then calculate the required sample size.
15.3 Example Scenario
Suppose you are planning to compare the effectiveness of three different training programs on employee productivity. Based on previous research, you anticipate a medium effect size (e.g., Cohen’s f = 0.25). Setting your significance level at 0.05 and desired power at 0.80, a power analysis might indicate that you need at least 60 participants per group to detect a significant difference.
16. Understanding Type I and Type II Errors
In statistical hypothesis testing, there are two types of errors that can occur: Type I errors and Type II errors. Understanding these errors is essential for interpreting the results of your statistical tests.
16.1 Type I Error (False Positive)
A Type I error occurs when you reject the null hypothesis when it is actually true. In other words, you conclude that there is a significant difference between groups when there is not. The probability of making a Type I error is denoted by α (alpha), which is typically set at 0.05.
16.2 Type II Error (False Negative)
A Type II error occurs when you fail to reject the null hypothesis when it is actually false. In other words, you conclude that there is no significant difference between groups when there is. The probability of making a Type II error is denoted by β (beta).
16.3 Balancing Type I and Type II Errors
There is an inherent trade-off between Type I and Type II errors. Decreasing the probability of making a Type I error (e.g., by using a more stringent significance level) increases the probability of making a Type II error, and vice versa. Researchers must carefully consider the consequences of each type of error when designing their studies and interpreting their results.
17. Visualizing Data to Enhance Understanding
Visualizing your data can greatly enhance your understanding of the relationships between groups and help communicate your findings more effectively.
17.1 Box Plots
Box plots are a useful way to visualize the distribution of data within each group. They display the median, quartiles, and outliers, providing a quick overview of the central tendency and variability of the data.
17.2 Bar Charts
Bar charts are commonly used to compare the means of different groups. Error bars can be added to represent the standard error or confidence intervals, providing an indication of the uncertainty around the means.
17.3 Histograms
Histograms provide a visual representation of the distribution of the data within each group. They can help you assess whether the data is normally distributed or skewed.
18. Addressing Outliers in Your Data
Outliers are data points that deviate significantly from the rest of the data. They can have a disproportionate influence on statistical results, so it’s important to identify and address them appropriately.
18.1 Identifying Outliers
Outliers can be identified using various methods, such as:
- Visual Inspection: Examining box plots or scatter plots to identify data points that fall far from the main cluster.
- Z-Scores: Calculating the z-score for each data point and considering values above a certain threshold (e.g., z > 3) as outliers.
- Interquartile Range (IQR): Identifying data points that fall below Q1 – 1.5 IQR or above Q3 + 1.5 IQR as outliers.
18.2 Handling Outliers
Once outliers have been identified, there are several approaches to handling them:
- Removal: Removing outliers from the data set. This should be done cautiously and only if there is a valid reason to believe that the outliers are due to errors or anomalies.
- Transformation: Applying a mathematical transformation to the data (e.g., logarithmic transformation) to reduce the influence of outliers.
- Winsorizing: Replacing extreme values with less extreme values. For example, replacing the top 5% of values with the value at the 95th percentile.
19. Ethical Considerations in Data Analysis
Ethical considerations are paramount in data analysis. Researchers have a responsibility to conduct their analyses in a manner that is transparent, unbiased, and respectful of participants’ rights.
19.1 Data Integrity
Ensure that your data is accurate and free from errors. Avoid fabricating or manipulating data to achieve desired results.
19.2 Transparency
Clearly document your data collection and analysis procedures. Be transparent about your choices and decisions.
19.3 Bias
Minimize bias in your data analysis. Be aware of your own assumptions and biases, and take steps to mitigate their influence.
19.4 Confidentiality
Protect the confidentiality of your participants. Store data securely and avoid disclosing identifying information.
20. Future Trends in Statistical Testing
The field of statistical testing is constantly evolving, with new methods and approaches being developed to address emerging challenges.
20.1 Bayesian Statistics
Bayesian statistics is gaining popularity as an alternative to traditional frequentist statistics. Bayesian methods allow you to incorporate prior knowledge into your analysis and provide a more intuitive interpretation of results.
20.2 Machine Learning
Machine learning algorithms are being increasingly used for data analysis and prediction. These algorithms can handle complex data sets with many variables and can identify patterns that might be missed by traditional statistical methods.
20.3 Big Data
The availability of big data is creating new opportunities and challenges for statistical testing. New methods are being developed to analyze large, complex data sets and extract meaningful insights.
By understanding these key concepts and principles, you can effectively choose and apply the appropriate statistical tests for comparing three or more groups and draw meaningful conclusions from your data. Remember to always consider the assumptions of the tests, report effect sizes, and interpret your results in the context of your research question.
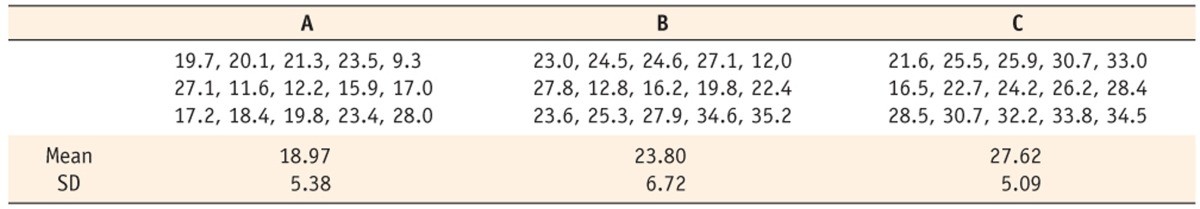 ANOVA Example
FAQ: Statistical Tests for Comparing Three Groups
21. What if my data has outliers?
If your data has outliers, consider using robust statistical methods that are less sensitive to extreme values, such as the Welch’s ANOVA or non-parametric tests like the Kruskal-Wallis test. Additionally, explore potential reasons for the outliers and consider whether they should be removed or transformed.
22. Can I use a t-test for comparing three groups if I adjust the p-value?
While adjusting the p-value (e.g., using the Bonferroni correction) can help control the familywise error rate, it is generally not recommended to use multiple t-tests for comparing three or more groups. ANOVA and its non-parametric alternatives are more appropriate methods as they provide a more comprehensive analysis of variance between groups.
23. How do I choose between parametric and non-parametric tests?
Choose between parametric and non-parametric tests based on whether your data meets the assumptions of normality and homogeneity of variance. If your data is normally distributed and has equal variances, parametric tests like ANOVA are appropriate. If your data violates these assumptions, non-parametric tests like the Kruskal-Wallis test are more suitable.
24. What is the difference between one-way ANOVA and two-way ANOVA?
One-way ANOVA is used when you have one independent variable with three or more levels (groups). Two-way ANOVA is used when you have two independent variables and want to examine their main effects and interaction effects on a dependent variable.
25. How do I interpret the results of a post-hoc test?
Post-hoc tests identify which specific groups are significantly different from each other after ANOVA reveals an overall significant difference. Interpret the p-values from the post-hoc test to determine which pairwise comparisons are statistically significant.
26. What are the key assumptions of ANOVA?
The key assumptions of ANOVA are normality, homogeneity of variance, and independence of observations.
27. How do I check if my data meets the assumptions of ANOVA?
You can check the assumptions of ANOVA using various diagnostic tools, such as:
- Normality: Histograms, Q-Q plots, and Shapiro-Wilk test
- Homogeneity of Variance: Levene’s test
28. What if I have missing data?
If you have missing data, consider using appropriate methods for handling missing data, such as imputation or listwise deletion. The choice of method depends on the amount and pattern of missing data.
29. How do I report effect size?
Report effect size measures such as Cohen’s d, eta-squared (η²), or omega-squared (ω²) alongside p-values to provide a more complete picture of the research findings.
30. What are some common statistical software packages for conducting these tests?
Common statistical software packages for conducting these tests include SPSS, R, SAS, and Excel.
Choosing the right statistical test can be daunting, but resources like COMPARE.EDU.VN are here to help. Remember, the most appropriate test depends on your data’s characteristics and your research question. With the right approach, you can confidently analyze your data and draw meaningful conclusions.
Need more help comparing and contrasting different statistical tests? Visit COMPARE.EDU.VN today to explore our comprehensive guides and make informed decisions. Our platform provides detailed comparisons, user reviews, and expert insights to help you navigate the complexities of statistical analysis. Make your research process smoother and more efficient with COMPARE.EDU.VN.
Contact Us:
Address: 333 Comparison Plaza, Choice City, CA 90210, United States
Whatsapp: +1 (626) 555-9090
Website: compare.edu.vn