P-value comparison is crucial for assessing the statistical significance of research findings; therefore, what do you compare the p-value to? Typically, the p-value is compared to a predetermined significance level (alpha), commonly set at 0.05, to determine whether the null hypothesis should be rejected. At COMPARE.EDU.VN, we help simplify this complex comparison process. Understanding this benchmark is essential for interpreting research results and making informed decisions based on data. By understanding the threshold for statistical significance, you can confidently assess the validity of research findings and make informed decisions, leveraging statistical tools for robust analysis, understanding statistical power and effect size for a more complete assessment.
1. Understanding the P-Value: A Comprehensive Guide
The p-value is a cornerstone of statistical hypothesis testing. It quantifies the probability of observing a result as extreme as, or more extreme than, the one obtained, assuming that the null hypothesis is true. In simpler terms, it tells us how likely the observed data is if there’s no real effect or relationship in the population. A low p-value suggests that the observed result is unlikely to have occurred by chance alone, providing evidence against the null hypothesis.
1.1. Defining the P-Value
The p-value, short for “probability value,” is a statistical measure that indicates the probability of obtaining results as extreme as, or more extreme than, the results actually observed in a statistical test, assuming that the null hypothesis is true. It is a number between 0 and 1 and is used to assess the evidence against the null hypothesis.
1.1.1. Key Characteristics of the P-Value
- Range: The p-value ranges from 0 to 1.
- Interpretation: A small p-value (typically ≤ 0.05) indicates strong evidence against the null hypothesis, while a large p-value (> 0.05) suggests weak evidence against the null hypothesis.
- Use: It is used to determine the statistical significance of the results.
1.2. The Role of the Null Hypothesis
The null hypothesis is a statement of no effect or no difference. It’s the default assumption we start with when conducting a statistical test. For example, if we’re comparing the effectiveness of two drugs, the null hypothesis would be that there’s no difference in their effectiveness. The p-value helps us determine whether there’s enough evidence to reject this null hypothesis.
1.2.1. Defining the Null Hypothesis
The null hypothesis (H0) is a statement that there is no effect or no difference. It is the starting point for hypothesis testing and is assumed to be true until there is sufficient evidence to reject it.
1.2.2. Examples of Null Hypotheses
- There is no difference in the average height of men and women.
- A new drug has no effect on reducing blood pressure.
- There is no correlation between smoking and lung cancer.
1.3. Calculating the P-Value
P-values are calculated using statistical software or tables based on the probability distribution of the test statistic. The calculation depends on the type of statistical test being performed.
1.3.1. Common Statistical Tests and P-Value Calculation
- T-test: Compares the means of two groups. The p-value is calculated based on the t-statistic and degrees of freedom.
- ANOVA: Compares the means of three or more groups. The p-value is calculated based on the F-statistic and degrees of freedom.
- Chi-square test: Tests the association between categorical variables. The p-value is calculated based on the chi-square statistic and degrees of freedom.
- Regression analysis: Examines the relationship between a dependent variable and one or more independent variables. The p-value is calculated for each coefficient based on the t-statistic and degrees of freedom.
1.4. Visualizing P-Values
Understanding p-values can be enhanced through visual aids. Histograms and distributions, often generated by statistical software, provide a clear representation of the data’s spread and the likelihood of obtaining observed results under the null hypothesis. Visualizing the data helps researchers and decision-makers grasp the statistical significance more intuitively.
Alt Text: Visual representation of p-value distribution, illustrating the concept of statistical significance in hypothesis testing.
2. The Significance Level (Alpha): Setting the Threshold
The significance level, denoted as alpha (α), is a pre-determined threshold that defines the level of evidence required to reject the null hypothesis. It represents the probability of rejecting the null hypothesis when it is actually true (a Type I error).
2.1. Defining the Significance Level
The significance level (alpha, α) is the probability of rejecting the null hypothesis when it is true. It is usually set at 0.05, meaning there is a 5% risk of concluding that an effect exists when it does not.
2.2. Common Values for Alpha
The most common value for alpha is 0.05, which corresponds to a 5% chance of making a Type I error. Other common values include 0.01 (1% chance) and 0.10 (10% chance), depending on the context and the desired level of stringency.
2.2.1. Choosing the Right Alpha Level
The choice of alpha depends on the balance between the risk of Type I error (false positive) and Type II error (false negative). A lower alpha reduces the risk of a false positive but increases the risk of a false negative, and vice versa.
2.3. The Relationship Between Alpha and Confidence Level
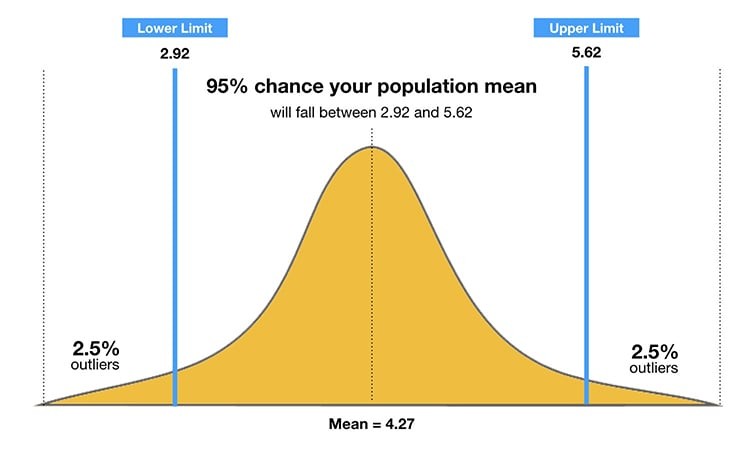
The confidence level is the complement of the significance level. It represents the probability that the true population parameter falls within the confidence interval. For example, if alpha is 0.05, the confidence level is 95%.
2.3.1. Understanding Confidence Intervals
A confidence interval is a range of values within which the true population parameter is estimated to lie with a certain level of confidence. It is calculated based on the sample data and the desired confidence level.
 Confidence Level Relationship
Alt Text: Illustrating the relationship between confidence intervals and p-values in statistical analysis.
3. Comparing the P-Value to Alpha: Making a Decision
The core of hypothesis testing lies in comparing the p-value to the significance level (alpha). This comparison determines whether the evidence is strong enough to reject the null hypothesis.
3.1. The Decision Rule
- If the p-value is less than or equal to alpha (p ≤ α), reject the null hypothesis.
- If the p-value is greater than alpha (p > α), fail to reject the null hypothesis.
3.1.1. Interpreting the Results
- Reject the null hypothesis: There is statistically significant evidence to support the alternative hypothesis.
- Fail to reject the null hypothesis: There is not enough evidence to support the alternative hypothesis.
3.2. Examples of P-Value vs. Alpha Comparison
- Example 1: p = 0.03, α = 0.05. Since p ≤ α, reject the null hypothesis.
- Example 2: p = 0.10, α = 0.05. Since p > α, fail to reject the null hypothesis.
- Example 3: p = 0.001, α = 0.01. Since p ≤ α, reject the null hypothesis.
3.3. Visual Aids for P-Value Comparison
Visual tools like decision trees can simplify the process of comparing p-values to alpha. These trees provide a step-by-step guide, helping researchers and decision-makers quickly determine whether to reject or fail to reject the null hypothesis based on the p-value and chosen significance level.
Alt Text: A decision tree illustrating the comparison process between p-values and the significance level (alpha) in hypothesis testing.
4. Understanding Type I and Type II Errors
In hypothesis testing, there are two types of errors that can occur: Type I and Type II errors. Understanding these errors is crucial for interpreting the results of statistical tests.
4.1. Type I Error (False Positive)
A Type I error occurs when we reject the null hypothesis when it is actually true. The probability of making a Type I error is equal to the significance level (alpha).
4.1.1. Consequences of Type I Errors
Type I errors can lead to false conclusions and incorrect decisions. For example, in medical research, a Type I error could lead to the approval of an ineffective drug.
4.2. Type II Error (False Negative)
A Type II error occurs when we fail to reject the null hypothesis when it is actually false. The probability of making a Type II error is denoted as beta (β).
4.2.1. Consequences of Type II Errors
Type II errors can also lead to incorrect decisions. For example, in medical research, a Type II error could lead to the rejection of an effective drug.
4.3. Balancing Type I and Type II Errors
The choice of alpha involves balancing the risk of Type I and Type II errors. Decreasing alpha reduces the risk of a Type I error but increases the risk of a Type II error, and vice versa.
4.3.1. Statistical Power
Statistical power is the probability of correctly rejecting the null hypothesis when it is false. It is equal to 1 – β. Increasing the sample size or the effect size can increase statistical power.
Alt Text: Illustrating Type I and Type II errors in statistical hypothesis testing.
5. The Limitations of P-Values
While p-values are a valuable tool in statistical analysis, they have limitations that should be considered when interpreting research results.
5.1. P-Values Do Not Indicate the Size of an Effect
A statistically significant p-value does not necessarily mean that the effect is large or practically important. It only indicates that the effect is unlikely to have occurred by chance.
5.2. P-Values Are Affected by Sample Size
With a large enough sample size, even a small effect can produce a statistically significant p-value. Therefore, it’s important to consider the sample size when interpreting p-values.
5.3. P-Values Can Be Misinterpreted
P-values are often misinterpreted as the probability that the null hypothesis is true. However, the p-value is the probability of observing the data, given that the null hypothesis is true.
5.4. Addressing P-Value Limitations
To overcome the limitations of p-values, researchers often use effect sizes and confidence intervals alongside p-values. Effect sizes provide a measure of the magnitude of the effect, while confidence intervals provide a range of plausible values for the population parameter. These additional measures provide a more complete picture of the research findings.
Alt Text: A visual guide explaining the concept of effect size and its significance in statistical analysis.
6. Alternatives to P-Values
Given the limitations of p-values, some researchers advocate for the use of alternative statistical methods.
6.1. Bayesian Statistics
Bayesian statistics provides a framework for updating beliefs based on evidence. It uses Bayes’ theorem to calculate the probability of a hypothesis given the data.
6.2. Confidence Intervals
Confidence intervals provide a range of plausible values for the population parameter. They can be used to assess the precision of the estimate and to determine whether the effect is practically important.
6.3. Effect Sizes
Effect sizes provide a measure of the magnitude of the effect. They are not affected by sample size and can be used to compare the results of different studies.
6.4. Enhanced Statistical Tools
Advanced statistical tools, such as meta-analysis and Bayesian methods, offer more robust alternatives to traditional p-value-based hypothesis testing. Meta-analysis combines results from multiple studies to increase statistical power, while Bayesian methods incorporate prior knowledge to provide more nuanced insights. These tools help researchers make more informed decisions and reduce reliance on p-values alone.
Alt Text: Illustrating Bayesian statistics through a probability tree diagram, showing how prior beliefs are updated with new evidence.
7. Real-World Applications of P-Value Comparison
Understanding and applying p-value comparison is crucial in various fields, enhancing decision-making and research validity.
7.1. Medical Research
In medical research, p-values are used to determine the effectiveness of new treatments. For example, a clinical trial comparing a new drug to a placebo might use a p-value to assess whether the drug has a statistically significant effect on patient outcomes. Researchers compare the p-value to a predetermined alpha level (e.g., 0.05) to decide whether to reject the null hypothesis that there is no difference between the drug and the placebo.
Example: Drug Efficacy Study
A pharmaceutical company conducts a clinical trial to test the efficacy of a new drug in reducing blood pressure. The results show a p-value of 0.02. If the significance level (alpha) is set at 0.05, the p-value is less than alpha, indicating that the drug has a statistically significant effect in reducing blood pressure.
7.2. Business and Marketing
Businesses use p-values to analyze the results of A/B tests, marketing campaigns, and customer surveys. For example, a company might use a p-value to determine whether a new marketing campaign has a statistically significant effect on sales. They compare the p-value to a significance level to decide whether to implement the new campaign.
Example: Marketing Campaign Analysis
A marketing team launches a new advertising campaign and wants to know if it has significantly increased website traffic. After running the campaign, they analyze the data and find a p-value of 0.08. If the significance level (alpha) is set at 0.05, the p-value is greater than alpha, indicating that the campaign’s effect on website traffic is not statistically significant.
7.3. Social Sciences
In social sciences, p-values are used to analyze survey data, experimental results, and observational studies. For example, a researcher might use a p-value to determine whether there is a statistically significant relationship between education level and income. They compare the p-value to a significance level to decide whether to reject the null hypothesis that there is no relationship between the two variables.
Example: Education and Income Study
A social scientist conducts a study to investigate the relationship between education level and annual income. The results show a p-value of 0.01. If the significance level (alpha) is set at 0.05, the p-value is less than alpha, indicating that there is a statistically significant relationship between education level and income.
7.4. Environmental Science
Environmental scientists use p-values to analyze data related to pollution levels, climate change, and biodiversity. For example, they might use a p-value to determine whether there has been a statistically significant change in air quality after implementing new environmental regulations. The comparison against a significance level helps determine the effectiveness of these measures.
Example: Air Quality Regulation Analysis
An environmental agency implements new regulations to reduce air pollution. After a year, they analyze the data and find a p-value of 0.03 for the change in air quality. If the significance level (alpha) is set at 0.05, the p-value is less than alpha, indicating that the new regulations have had a statistically significant effect on improving air quality.
7.5. Engineering
Engineers use p-values to analyze data from experiments, simulations, and quality control processes. For example, an engineer might use a p-value to determine whether a new design for a bridge is more structurally sound than the old design. The p-value helps them determine if the observed differences are statistically significant.
Example: Bridge Design Improvement
Engineers develop a new design for a bridge and conduct simulations to test its structural integrity. The results show a p-value of 0.04 when comparing the new design to the old one. If the significance level (alpha) is set at 0.05, the p-value is less than alpha, indicating that the new design is significantly more structurally sound.
By providing concrete examples across different fields, it becomes clear how p-value comparison is essential for making data-driven decisions and ensuring the validity of research findings.
Alt Text: A graphical representation illustrating the diverse applications of p-values across different fields such as medicine, business, and social sciences.
8. Best Practices for Using P-Values
To ensure the proper use and interpretation of p-values, it is important to follow best practices in statistical analysis.
8.1. State the Hypotheses Clearly
Clearly state the null and alternative hypotheses before conducting the statistical test. This helps to avoid bias and ensures that the test is focused on the research question.
8.2. Choose the Appropriate Statistical Test
Select the appropriate statistical test based on the type of data and the research question. Using the wrong test can lead to incorrect p-values and invalid conclusions.
8.3. Check the Assumptions of the Test
Ensure that the assumptions of the statistical test are met. Violating the assumptions can lead to inaccurate p-values and unreliable results.
8.4. Interpret the P-Value in Context
Interpret the p-value in the context of the study design, sample size, and other relevant factors. Avoid over-interpreting the p-value and consider other evidence when making decisions.
8.5. Report Effect Sizes and Confidence Intervals
Report effect sizes and confidence intervals alongside p-values to provide a more complete picture of the research findings. This helps to assess the practical importance of the results and to compare the results of different studies.
8.6. Maintain Transparency
Transparency in data analysis is crucial for ensuring the credibility and reproducibility of research findings. Researchers should clearly document their methods, assumptions, and decision-making processes. Sharing data and code allows other researchers to verify the results and build upon the findings. Transparent reporting enhances the trustworthiness of research and facilitates the accumulation of scientific knowledge.
Alt Text: An infographic summarizing best practices for statistical analysis, emphasizing transparency, appropriate test selection, and contextual interpretation.
9. Common Misconceptions About P-Values
P-values are often misunderstood, leading to incorrect interpretations and conclusions. Addressing these misconceptions is crucial for the proper use of p-values.
9.1. A Small P-Value Proves the Alternative Hypothesis
A small p-value provides evidence against the null hypothesis, but it does not prove the alternative hypothesis. There is always a chance that the result is due to chance or other factors.
9.2. A Large P-Value Means the Null Hypothesis Is True
A large p-value means that there is not enough evidence to reject the null hypothesis, but it does not mean that the null hypothesis is true. The null hypothesis may be false, but the study may not have enough power to detect the effect.
9.3. P-Values Measure the Size of an Effect
P-values do not measure the size of an effect. They only indicate whether the effect is statistically significant. Effect sizes should be used to measure the magnitude of the effect.
9.4. P-Values Are the Probability That the Results Are Due to Chance
P-values are not the probability that the results are due to chance. They are the probability of observing the data, given that the null hypothesis is true.
9.5. Statistical Significance Equals Practical Significance
Statistical significance does not equal practical significance. A statistically significant result may not be practically important or meaningful in the real world.
9.6. Addressing Common Fallacies
To combat common misconceptions, statistical education is essential. Researchers, students, and professionals should receive thorough training in the proper interpretation and use of p-values. Emphasizing the limitations of p-values and promoting the use of supplementary measures such as effect sizes and confidence intervals can help prevent misinterpretations. Continuous education and clear communication are key to ensuring that statistical findings are understood and applied correctly.
Alt Text: A visual guide addressing common misconceptions about p-values in statistical analysis.
10. Frequently Asked Questions (FAQ) About P-Values
10.1. What is a p-value in simple terms?
A p-value is a measure of the probability that an observed difference could have occurred just by random chance. The lower the p-value, the less likely it is that the results are due to chance.
10.2. How do you interpret a p-value of 0.05?
A p-value of 0.05 means that there is a 5% chance of observing a result as extreme as, or more extreme than, the one obtained, assuming that the null hypothesis is true.
10.3. What is the difference between p-value and alpha?
Alpha (α) is the predetermined significance level used as a threshold for rejecting the null hypothesis. The p-value is compared to alpha to make a decision about the null hypothesis.
10.4. Can you have a p-value of 0?
While theoretically possible, a p-value of exactly 0 is extremely rare. It would imply that the observed data is impossible under the null hypothesis.
10.5. What does it mean to fail to reject the null hypothesis?
Failing to reject the null hypothesis means that there is not enough evidence to support the alternative hypothesis. It does not mean that the null hypothesis is true.
10.6. How does sample size affect the p-value?
Larger sample sizes can lead to smaller p-values, even for small effects. Therefore, it’s important to consider the sample size when interpreting p-values.
10.7. What is a good p-value for statistical significance?
A p-value of 0.05 or lower is typically considered statistically significant, but the appropriate threshold depends on the context and the desired level of stringency.
10.8. What are the alternatives to p-values?
Alternatives to p-values include Bayesian statistics, confidence intervals, and effect sizes. These methods provide a more complete picture of the research findings.
10.9. How can p-values be misused?
P-values can be misused by over-interpreting them, ignoring effect sizes, and selectively reporting significant results. It’s important to follow best practices in statistical analysis to avoid these pitfalls.
10.10. Where can I learn more about p-values?
You can learn more about p-values from statistics textbooks, online courses, and consulting with a statistician. Additionally, websites like COMPARE.EDU.VN offer resources and guides on statistical concepts.
Alt Text: A compilation of frequently asked questions (FAQs) about p-values, addressing common queries and concerns about their interpretation and application.
The p-value is a fundamental concept in statistical hypothesis testing. It quantifies the evidence against the null hypothesis and is compared to the significance level (alpha) to make decisions about the hypothesis. While p-values have limitations, they remain a valuable tool when used properly and interpreted in context. Understanding p-values, their limitations, and best practices is essential for anyone involved in research or data analysis.
At COMPARE.EDU.VN, we understand that navigating statistical concepts like p-values can be challenging. That’s why we strive to provide clear, comprehensive explanations and resources to help you make informed decisions. Whether you’re comparing different research findings, evaluating statistical significance, or need assistance with data analysis, COMPARE.EDU.VN is here to support you.
Don’t let the complexities of p-values and statistical analysis hold you back. Visit COMPARE.EDU.VN today and discover how our expert guidance can empower you to make smarter, data-driven choices. For more information, contact us at 333 Comparison Plaza, Choice City, CA 90210, United States, or reach out via WhatsApp at +1 (626) 555-9090. Let compare.edu.vn be your trusted partner in understanding and applying statistical insights.