Comparable company analysis is a crucial valuation tool. COMPARE.EDU.VN offers a detailed guide on how to leverage it effectively. This guide breaks down the process of valuing a company using comparables, offering insights into financial metrics and valuation techniques to drive business valuations. Discover how to make informed investment decisions.
1. What is Comparable Company Analysis?
Comparable company analysis (CCA), often shortened to “comps,” is a relative valuation method that determines the value of a company by examining the ratios of similar publicly traded companies. Unlike intrinsic valuation methods like discounted cash flow (DCF) analysis, which relies on a company’s internal cash flow projections, CCA benchmarks a company’s value against its peers in the market.
This method hinges on the assumption that similar companies should have similar valuation multiples, such as price-to-earnings (P/E) or enterprise value-to-EBITDA (EV/EBITDA). By identifying comparable companies and analyzing their financial ratios, analysts can derive a reasonable valuation range for the target company.
2. What are the Key Steps in Performing Comparable Company Analysis?
Performing comparable company analysis requires a systematic approach to ensure accuracy and relevance. The main steps are:
- Identifying Comparable Companies: Find publicly traded companies that operate in the same industry, have similar business models, and face comparable risks.
- Gathering Financial Information: Collect the necessary financial data from the comparable companies, including historical financial statements and analyst estimates.
- Creating a Comps Table: Organize the data in a structured table, including key financial metrics and ratios for each company.
- Calculating Valuation Multiples: Calculate relevant valuation multiples, such as EV/Revenue, EV/EBITDA, and P/E, for each comparable company.
- Applying Multiples to the Target Company: Use the calculated multiples to estimate the value of the target company, considering any differences between the target and the comparables.
3. How Do You Find the Right Comparable Companies?
Finding the right comparable companies is a critical and often subjective step in the analysis. The goal is to identify companies that are as similar as possible to the target company in terms of industry, business model, size, growth prospects, and risk profile.
Begin by thoroughly researching the target company to understand its business operations, industry classification, and key characteristics. Use financial databases like Capital IQ or Bloomberg to identify potential comparables based on industry codes and business descriptions. Refine the list by considering factors such as:
- Industry Classification: Ensure that the comparables operate in the same industry or closely related industries as the target company.
- Geography: Consider companies that operate in the same geographic region or have similar geographic exposure.
- Size: Look for companies with similar revenue, assets, and market capitalization.
- Growth Rate: Find companies with similar historical and projected growth rates.
- Profitability: Compare companies with similar margins and profitability metrics.
- Business Model: Analyze companies with similar business models, revenue streams, and cost structures.
4. What Financial Information Needs to Be Gathered?
The financial information needed for comparable company analysis includes both historical data and analyst estimates. Key data points to collect are:
- Revenue: Historical and projected revenue figures.
- Gross Profit: Gross profit margins and amounts.
- EBITDA: Earnings before interest, taxes, depreciation, and amortization.
- Net Income: Net income and earnings per share (EPS).
- Total Debt: Total debt outstanding.
- Cash and Equivalents: Cash and short-term investments.
- Market Capitalization: Current market capitalization.
- Equity Information: Shares outstanding and stock price.
Gather this data from company filings (10-K, 10-Q), investor presentations, and financial databases. Analyst estimates, particularly for revenue and earnings, can be obtained from services like Thomson Reuters or FactSet.
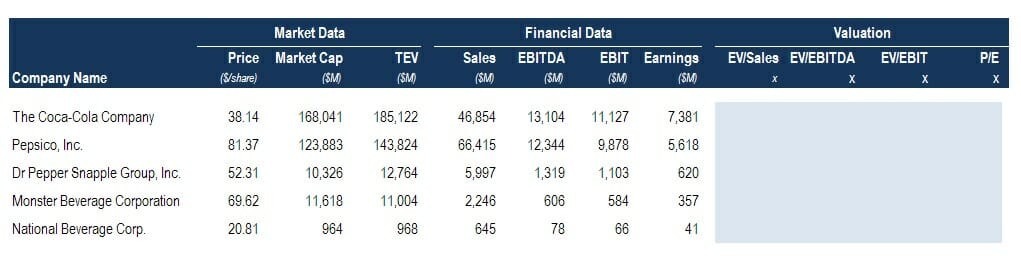
5. How to Set Up a Comps Table in Excel?
Setting up a comps table in Excel involves organizing the gathered financial information in a clear and structured format. Here’s a step-by-step guide:
- List Comparable Companies: In the first column, list the names or ticker symbols of the comparable companies.
- Add Financial Data: Add columns for key financial data points, such as revenue, gross profit, EBITDA, and net income. Include historical data (e.g., last fiscal year) and projected data (e.g., current fiscal year estimates).
- Calculate Valuation Multiples: Create columns for the valuation multiples you plan to use, such as EV/Revenue, EV/EBITDA, and P/E. Use formulas to calculate these multiples based on the financial data.
- Add Market Data: Include columns for market data, such as current stock price and market capitalization.
- Format the Table: Use formatting to make the table easy to read. Clearly label each column and row, use consistent number formats, and highlight key data points.
Here’s an example of how a comps table might look:
| Company | Revenue (LTM) | EBITDA (LTM) | Market Cap | EV | EV/Revenue | EV/EBITDA | P/E |
|---|---|---|---|---|---|---|---|
| Company A | $1,000 | $200 | $1,500 | $2,000 | 2.0x | 10.0x | 15.0x |
| Company B | $1,200 | $240 | $1,800 | $2,400 | 2.0x | 10.0x | 15.0x |
| Company C | $800 | $160 | $1,200 | $1,600 | 2.0x | 10.0x | 15.0x |
| Target | $900 | $180 | N/A | N/A | N/A | N/A | N/A |
 Comps Table Setup Example
6. What are the Most Common Valuation Ratios in Comparable Company Analysis?
Several valuation ratios are commonly used in comparable company analysis, each providing different insights into a company’s value. The most common ratios include:
6.1. Enterprise Value to Revenue (EV/Revenue)
This ratio compares a company’s enterprise value (market capitalization plus net debt) to its revenue. It is useful for valuing companies with negative earnings or inconsistent profitability.
Formula: EV / Revenue
6.2. Enterprise Value to Earnings Before Interest, Taxes, Depreciation, and Amortization (EV/EBITDA)
This ratio compares a company’s enterprise value to its EBITDA. It is one of the most widely used valuation multiples, as it reflects a company’s operating performance without the impact of financing and accounting decisions.
Formula: EV / EBITDA
6.3. Price to Earnings (P/E)
This ratio compares a company’s stock price to its earnings per share (EPS). It is a simple and widely recognized valuation metric, but it can be distorted by accounting practices and is not useful for companies with negative earnings.
Formula: Stock Price / EPS
6.4. Price to Book (P/B)
This ratio compares a company’s market capitalization to its book value of equity. It is often used to value companies in asset-intensive industries, such as banking and real estate.
Formula: Market Capitalization / Book Value of Equity
6.5. Price to Sales (P/S)
This ratio compares a company’s market capitalization to its revenue. It is useful for valuing companies with high growth rates or negative earnings.
Formula: Market Capitalization / Revenue
6.6. Other Industry-Specific Ratios
Depending on the industry, other valuation ratios may be relevant. For example, in the real estate industry, the price to net asset value (P/NAV) ratio is often used. In the technology industry, metrics like monthly recurring revenue (MRR) multiples are common for SaaS businesses.
7. How to Use Multiples from Comparable Companies to Value the Target Company?
Once the valuation multiples have been calculated for the comparable companies, the next step is to apply these multiples to the target company to estimate its value. There are several ways to do this:
- Calculate the Average Multiple: Calculate the average of each valuation multiple across the comparable companies. This provides a benchmark for the target company’s valuation.
- Calculate the Median Multiple: Calculate the median of each valuation multiple. The median is less sensitive to outliers than the average, making it a more robust measure.
- Apply the Multiples to the Target Company: Multiply the target company’s relevant financial metric (e.g., revenue, EBITDA, net income) by the average or median multiple to estimate its value.
- Consider Adjustments: Adjust the valuation range based on any differences between the target company and the comparables. For example, if the target company has a higher growth rate or lower risk profile, a premium may be warranted.
For example, if the median EV/EBITDA multiple for the comparable companies is 10x and the target company’s EBITDA is $100 million, the estimated enterprise value for the target company would be $1 billion (10x * $100 million).
8. What are the Common Pitfalls in Comparable Company Analysis?
Comparable company analysis, while widely used, has several potential pitfalls that analysts should be aware of:
- Finding Truly Comparable Companies: It can be challenging to find companies that are truly comparable to the target company. Differences in business models, geographies, and risk profiles can affect valuation multiples.
- Data Availability and Accuracy: The accuracy of the analysis depends on the availability and accuracy of financial data for the comparable companies.
- Ignoring Qualitative Factors: CCA focuses on quantitative data and may overlook important qualitative factors, such as management quality, competitive advantages, and regulatory environment.
- Circular Reasoning: Using valuation multiples derived from the market can lead to circular reasoning if the market itself is overvalued or undervalued.
- Static Analysis: CCA provides a snapshot of value at a particular point in time and does not account for future changes in the company’s performance or market conditions.
9. How to Interpret the Results of a Comps Table?
Interpreting the results of a comps table involves more than just looking at the average or median multiples. Analysts need to understand the underlying drivers of the valuation multiples and consider any differences between the target company and the comparables.
- Understand the Range of Multiples: Look at the range of valuation multiples across the comparable companies. A wide range may indicate that the comparables are not truly comparable or that there are significant differences in their business models or risk profiles.
- Identify Outliers: Identify any outliers in the data and investigate the reasons for their deviation. Outliers may be excluded from the analysis or adjusted to reflect their true value.
- Consider Company-Specific Factors: Consider any company-specific factors that may affect the target company’s valuation, such as its growth prospects, competitive position, and management quality.
- Compare to Other Valuation Methods: Compare the results of the CCA to other valuation methods, such as DCF analysis, to ensure that the valuation is reasonable and consistent.
10. What are the Applications of Comparable Company Analysis?
Comparable company analysis is used in a variety of contexts, including:
10.1. Investment Banking
Investment bankers use CCA to value companies in mergers and acquisitions (M&A) transactions, initial public offerings (IPOs), and other corporate finance deals.
10.2. Equity Research
Equity research analysts use CCA to assess the relative valuation of publicly traded companies and make buy, sell, or hold recommendations.
10.3. Corporate Development
Corporate development professionals use CCA to evaluate potential acquisition targets and assess the value of their own company.
10.4. Private Equity
Private equity firms use CCA to value potential investment targets and determine the appropriate purchase price.
10.5. Fairness Opinions
Fairness opinions are often required in M&A transactions to ensure that the transaction is fair to the shareholders of the target company. CCA is a key component of fairness opinions.
10.6. Restructuring
In restructuring situations, CCA can be used to value companies and determine the appropriate reorganization plan.
11. What Role Do Multiples Play in Financial Modeling?
Multiples play a significant role in financial modeling, particularly in the terminal value calculation of a discounted cash flow (DCF) model. The terminal value represents the value of a company beyond the explicit forecast period and is often estimated using a multiple-based approach.
The most common approach is to apply an exit multiple, such as EV/EBITDA, to the company’s projected EBITDA in the final year of the forecast period. The exit multiple is typically based on the average or median EV/EBITDA multiple of comparable companies.
Multiples can also be used to sanity-check the results of a financial model. If the model implies a valuation multiple that is significantly higher or lower than the multiples of comparable companies, it may indicate that the model’s assumptions are unrealistic or that there are errors in the calculations.
12. How Does Comparable Company Analysis Relate to Other Valuation Methods?
Comparable company analysis is just one of several valuation methods used by financial analysts. Other common methods include:
- Discounted Cash Flow (DCF) Analysis: DCF analysis is an intrinsic valuation method that values a company based on the present value of its expected future cash flows.
- Precedent Transactions Analysis: Precedent transactions analysis values a company based on the prices paid for similar companies in past M&A transactions.
- Asset-Based Valuation: Asset-based valuation values a company based on the value of its assets, less its liabilities.
Each valuation method has its strengths and weaknesses, and analysts often use a combination of methods to arrive at a comprehensive valuation. CCA is typically used in conjunction with DCF analysis to provide a market-based perspective on value.
13. What Are Some Advanced Techniques in Comparable Company Analysis?
While the basic principles of CCA are straightforward, there are several advanced techniques that analysts can use to refine their analysis:
- Regression Analysis: Regression analysis can be used to identify the key drivers of valuation multiples and to adjust for differences between the target company and the comparables.
- Relative Multiple Analysis: Relative multiple analysis involves comparing the valuation multiples of the target company to those of its peers over time to identify trends and potential mispricings.
- Sensitivity Analysis: Sensitivity analysis involves varying the key assumptions in the analysis to assess the impact on the valuation.
14. FAQ: Frequently Asked Questions
14.1. What Is a Good EV/EBITDA Multiple?
A “good” EV/EBITDA multiple varies by industry, growth prospects, and market conditions. Generally, a higher multiple suggests higher growth expectations or lower risk.
14.2. How Many Comps Should I Include?
Aim for a minimum of 3-5 comparable companies to provide a reasonable range and reduce the impact of outliers.
14.3. Should I Use Average or Median Multiples?
Median multiples are generally preferred as they are less sensitive to outliers.
14.4. How Do I Adjust for Differences Between Comps?
Use regression analysis or qualitative adjustments to account for differences in growth, risk, or business models.
14.5. What If I Can’t Find Good Comps?
Consider broadening your search criteria or using precedent transactions analysis as an alternative.
14.6. Can CCA Be Used for Private Companies?
Yes, but data availability is limited. Public comps can be used as a starting point, with adjustments for illiquidity and other factors.
14.7. How Often Should I Update My Comps?
Update your comps regularly, especially after earnings announcements or significant market events.
14.8. What Are the Limitations of CCA?
CCA relies on market data and may not reflect intrinsic value. It also requires careful selection of comparable companies and is sensitive to outliers.
14.9. Is CCA Enough for a Valuation?
No, CCA should be used in conjunction with other valuation methods like DCF analysis for a comprehensive valuation.
14.10. Where Can I Find Reliable Financial Data?
Use reputable sources like Bloomberg, Capital IQ, SEC filings, and company investor relations websites.
15. Ready to Make Smarter Financial Decisions?
Navigating the complexities of company valuation can be daunting. That’s why COMPARE.EDU.VN is here to help. Whether you’re an investor, analyst, or business owner, our comprehensive comparison tools and expert analysis provide the insights you need to make informed decisions. Don’t leave your financial future to chance—visit COMPARE.EDU.VN today and start comparing your way to success.
Want to dive deeper into comparable company analysis and other valuation techniques? Visit COMPARE.EDU.VN today for more detailed guides, templates, and expert insights. Our resources can help you master the art of valuation and make informed investment decisions.
Contact Information:
Address: 333 Comparison Plaza, Choice City, CA 90210, United States
WhatsApp: +1 (626) 555-9090
Website: compare.edu.vn