How To Prepare A Comparative Balance Sheet? A comparative balance sheet is a powerful tool for businesses to evaluate their financial standing and monitor their progress over time. COMPARE.EDU.VN offers a detailed guide on how to prepare a comparative balance sheet, highlighting its components, formulas, and advantages, providing a comprehensive overview of your financial performance. By understanding comparative financial statements and balance sheet analysis, you can make informed decisions about your business’s future.
1. What Is a Comparative Balance Sheet and Why Is It Important?
A comparative balance sheet presents a company’s financial position at two or more points in time, usually across accounting periods. This financial statement allows for a direct comparison of assets, liabilities, and equity, revealing trends, growth patterns, and potential financial risks. Analyzing these financial reports helps stakeholders understand financial stability and the company’s ability to meet its financial goals.
For example, if Company A’s assets increased from $500,000 in 2022 to $600,000 in 2023, this suggests positive growth. Conversely, if liabilities increased significantly, it could signal potential financial strain.
 Comparative Balance Sheet
2. What Are the Key Components of a Comparative Balance Sheet?
Understanding the components is essential for preparing and interpreting a comparative balance sheet. These key elements include assets, liabilities, and shareholders’ equity, each providing a unique insight into a company’s financial health.
2.1. Assets: What Does the Company Own?
Assets are the resources a company owns, categorized into current and non-current assets. Current assets, such as cash, accounts receivable, and inventory, can be converted into cash within a year. Non-current assets, including property, plant, equipment (PPE), and long-term investments, provide benefits for more than one year.
- Current Assets: Include cash and equivalents, accounts receivable, inventory, and prepaid expenses.
- Non-Current Assets: Include property, plant, and equipment (PPE), intangible assets, and long-term investments.
2.2. Liabilities: What Does the Company Owe?
Liabilities represent a company’s obligations or debts, also divided into current and non-current. Current liabilities, such as accounts payable and short-term loans, must be settled within one year. Non-current liabilities include long-term debt and deferred tax liabilities extending beyond one year.
- Current Liabilities: Include accounts payable, short-term debt, and accrued liabilities.
- Non-Current Liabilities: Include long-term debt, deferred tax liabilities, and other long-term obligations.
2.3. Shareholders’ Equity: What Is the Owners’ Stake?
Shareholders’ equity, also known as stockholders’ equity or owners’ equity, represents the residual interest in the company’s assets after deducting liabilities. It includes initial investments by shareholders and retained earnings accumulated over time.
- Components: Include common stock, retained earnings, and additional paid-in capital.
3. What Is the Standard Format for a Comparative Balance Sheet?
A comparative balance sheet typically presents financial data for two or more periods side-by-side. The format includes columns for each year being compared, with line items for assets, liabilities, and equity. Here’s an illustrative example:
Company XYZ
Comparative Balance Sheet
As of December 2022 and December 2023
| 2022 (INR) | 2023 (INR) | |
|---|---|---|
| ASSETS | ||
| Current Assets | ||
| Cash and Cash Equivalents | X,XXX | X,XXX |
| Accounts Receivable | X,XXX | X,XXX |
| Inventory | X,XXX | X,XXX |
| Prepaid Expenses | X,XXX | X,XXX |
| Total Current Assets | X,XXX | X,XXX |
| Non-Current Assets | ||
| Property, Plant, and Equipment | X,XXX | X,XXX |
| Intangible Assets | X,XXX | X,XXX |
| Investments | X,XXX | X,XXX |
| Total Non-Current Assets | X,XXX | X,XXX |
| Total Assets | X,XXX | X,XXX |
| LIABILITIES AND EQUITY | ||
| Current Liabilities | ||
| Accounts Payable | X,XXX | X,XXX |
| Short-Term Debt | X,XXX | X,XXX |
| Accrued Liabilities | X,XXX | X,XXX |
| Total Current Liabilities | X,XXX | X,XXX |
| Non-Current Liabilities | ||
| Long-Term Debt | X,XXX | X,XXX |
| Deferred Tax Liabilities | X,XXX | X,XXX |
| Other Long-Term Liabilities | X,XXX | X,XXX |
| Total Non-Current Liabilities | X,XXX | X,XXX |
| Total Liabilities | X,XXX | X,XXX |
| SHAREHOLDERS’ EQUITY | ||
| Common Stock | X,XXX | X,XXX |
| Retained Earnings | X,XXX | X,XXX |
| Additional Paid-in Capital | X,XXX | X,XXX |
| Total Shareholders’ Equity | X,XXX | X,XXX |
| Total Liabilities and Equity | X,XXX | X,XXX |
4. What Formulas and Calculations Are Used in Comparative Balance Sheets?
Analyzing a comparative balance sheet requires applying several formulas to derive meaningful insights. These calculations provide a clearer picture of a company’s financial performance and stability.
4.1. Percentage Change Formula: How Much Has Changed?
The percentage change formula helps determine the extent to which an item has increased or decreased between two periods.
Percentage Change = ((Current Year Value – Previous Year Value) / Previous Year Value) * 100
For example, if accounts receivable increased from $50,000 to $60,000, the percentage change is ((60,000 – 50,000) / 50,000) * 100 = 20%.
4.2. Working Capital Formula: Does the Company Have Enough Short-Term Liquidity?
Working capital measures a company’s short-term liquidity by calculating the difference between current assets and current liabilities.
Working Capital = Current Assets – Current Liabilities
Positive working capital indicates a company can cover its short-term liabilities with its short-term assets. A negative value might indicate liquidity issues.
4.3. Current Ratio Formula: Can the Company Meet Its Short-Term Obligations?
The current ratio assesses a company’s ability to meet its short-term obligations.
Current Ratio = Current Assets / Current Liabilities
A ratio greater than 1 suggests the company has sufficient assets to cover its current liabilities, while a ratio less than 1 may indicate potential liquidity challenges.
4.4. Debt-to-Equity Ratio Formula: How Leveraged Is the Company?
The debt-to-equity ratio gauges a company’s financial leverage.
Debt-to-Equity Ratio = Total Liabilities / Shareholders’ Equity
A high ratio suggests the company relies heavily on debt financing, potentially increasing financial risk.
4.5. Return on Assets (ROA) Formula: How Efficiently Are Assets Used?
ROA measures a company’s efficiency in generating net profit relative to its total assets.
ROA = Net Income / Average Total Assets
4.6. Return on Equity (ROE) Formula: How Effectively Is Equity Used?
ROE evaluates a company’s profitability relative to its shareholders’ equity.
ROE = Net Income / Average Shareholders’ Equity
This formula provides insights into the company’s ability to generate returns for its shareholders’ investments.
5. Comparative Balance Sheet Example: Analyzing Company ABC
To illustrate how a comparative balance sheet is used, let’s examine Company ABC for 2022 and 2023.
Company ABC – Comparative Balance Sheet
As of December 2022 and December 2023
| 2022 | 2023 | Percentage Change | |
|---|---|---|---|
| Assets | |||
| Current Assets | |||
| Cash and Cash Equivalents | $50,000 | $65,000 | 30% |
| Accounts Receivable | $45,000 | $52,000 | 15.56% |
| Inventory | $60,000 | $55,000 | -8.33% |
| Prepaid Expenses | $10,000 | $12,000 | 20% |
| Total Current Assets | $165,000 | $184,000 | 11.52% |
| Non-Current Assets | |||
| Property, Plant, and Equipment | $200,000 | $220,000 | 10% |
| Intangible Assets | $40,000 | $38,000 | -5% |
| Investments | $30,000 | $35,000 | 16.67% |
| Total Non-Current Assets | $270,000 | $293,000 | 8.52% |
| Total Assets | $435,000 | $477,000 | 9.66% |
| Liabilities and Equity | |||
| Current Liabilities | |||
| Accounts Payable | $30,000 | $28,000 | -6.67% |
| Short-Term Debt | $10,000 | $12,000 | 20% |
| Accrued Liabilities | $15,000 | $18,000 | 20% |
| Total Current Liabilities | $55,000 | $58,000 | 5.45% |
| Non-Current Liabilities | |||
| Long-Term Debt | $100,000 | $90,000 | -10% |
| Deferred Tax Liabilities | $20,000 | $18,000 | -10% |
| Other Long-Term Liabilities | $5,000 | $6,000 | 20% |
| Total Non-Current Liabilities | $125,000 | $114,000 | -8.8% |
| Total Liabilities | $180,000 | $172,000 | -4.44% |
| Shareholders’ Equity | |||
| Common Stock | $50,000 | $50,000 | 0% |
| Retained Earnings | $195,000 | $255,000 | 30.77% |
| Additional Paid-in Capital | $10,000 | $10,000 | 0% |
| Total Shareholders’ Equity | $255,000 | $315,000 | 23.53% |
| Total Liabilities and Equity | $435,000 | $477,000 | 9.66% |
5.1. Analyzing Asset Trends
Total assets increased by 9.66%, driven primarily by a substantial rise in cash and cash equivalents (30%) and investments (16.67%). However, inventory decreased by 8.33%, which may require further investigation.
5.2. Evaluating Liabilities
Total liabilities decreased by 4.44%, mainly due to reduced long-term debt (10%) and deferred tax liabilities (10%). This indicates effective management of long-term obligations.
5.3. Assessing Shareholders’ Equity
Shareholders’ equity experienced significant growth (23.53%), thanks to the considerable increase in retained earnings (30.77%), indicating profitability and effective earnings retention.
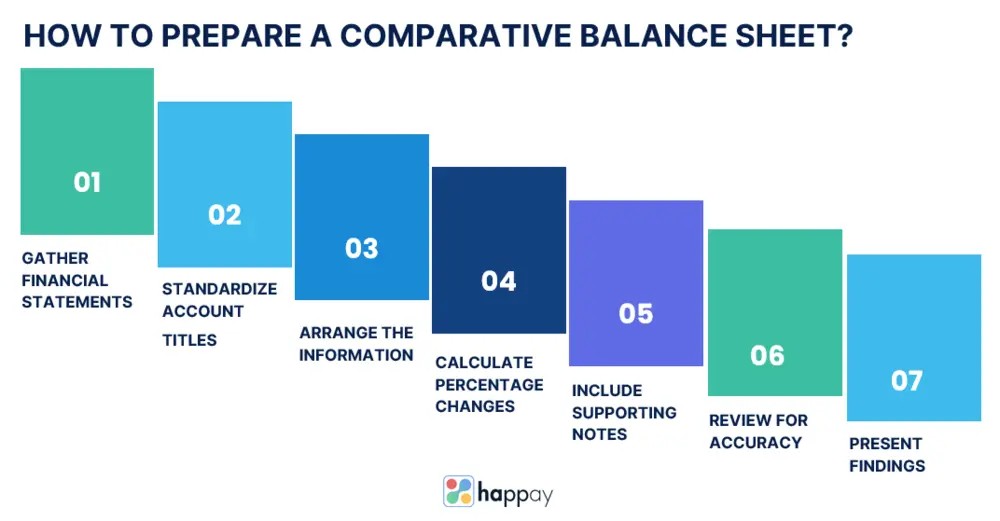
6. How to Prepare a Comparative Balance Sheet: Step-by-Step Guide
Preparing a comparative balance sheet involves organizing financial information from two or more accounting periods. Follow these steps to create a comprehensive comparative sheet.
6.1. Gather Financial Statements
Collect balance sheets from the accounting periods you want to compare, providing a detailed breakdown of assets, liabilities, and shareholders’ equity.
6.2. Standardize Account Titles
Ensure account titles are consistent across all periods for accurate comparisons. For example, “Accounts Receivable” should be labeled consistently in all periods.
6.3. Arrange the Information
Set up a table or spreadsheet with corresponding account titles and organize the data into columns for each accounting period.
6.4. Calculate Percentage Changes
Calculate the percentage change between periods for each line item using the formula: ((Current Year Value – Previous Year Value) / Previous Year Value) * 100.
6.5. Include Supporting Notes
Include footnotes to provide context for significant events, such as mergers or divestitures, that may have influenced changes in the balance sheet.
6.6. Review for Accuracy
Double-check all figures and calculations to ensure accuracy, as even small errors can lead to misleading conclusions.
6.7. Present Findings
Share the comparative sheet and your analysis with relevant stakeholders, clearly communicating your insights to help them understand the financial picture.
7. What Are the Advantages of Using a Comparative Balance Sheet?
Comparative balance sheets offer several advantages, making them an essential tool for financial analysis and decision-making.
7.1. Spotting Trends and Patterns
Comparing data from different periods allows you to identify trends and patterns, revealing whether specific assets or liabilities consistently increase or decrease.
7.2. Assessing Financial Performance
Tracking changes in essential line items like revenue, expenses, assets, and liabilities helps assess how well the company manages its resources and obligations.
7.3. Identifying Strengths and Weaknesses
Comparative balance sheets can highlight areas of strength and weakness, such as improved liquidity management or inventory management challenges.
7.4. Evaluating Efficiency and Productivity
They help assess the efficiency and productivity of a company’s operations, providing insights into the effectiveness of credit and collection policies.
7.5. Facilitating Decision-Making
Business decisions often involve considering the potential consequences on financial health. Comparative sheets offer a basis for informed decision-making regarding investments, financing, and cost-cutting measures.
7.6. Monitoring Financial Stability
Comparative balance sheets help monitor a company’s financial stability and resilience by assessing debt levels, equity, and working capital.
7.7. Benchmarking Against Industry Peers
They can serve as a benchmarking tool, allowing companies to compare their financial performance against industry peers.
7.8. Meeting Regulatory Requirements
Many regulatory bodies and investors expect businesses to provide comparative financial statements, ensuring compliance and enhancing credibility.
8. What Are the Limitations of Comparative Balance Sheets?
While comparative balance sheets are valuable, they have limitations that should be considered.
8.1. Limited Context
They provide data for multiple periods but may offer a partial picture without additional information, like economic conditions and one-time events.
8.2. Time Lag Effect
The time interval between periods can impact the relevance of the analysis due to economic changes or unforeseen events.
8.3. Seasonal Variations
Seasonal fluctuations in operations can skew the analysis, as the comparative sheet may not fully capture these variations.
8.4. Inflation and Currency Changes
Inflation and currency fluctuations can distort the value of assets and liabilities, making direct comparisons misleading.
8.5. Differences in Accounting Policies
Changes in accounting policies can impact the presentation of financial data, making it difficult to compare data consistently.
8.6. Non-Financial Factors
Comparative balance sheets focus solely on financial data, overlooking non-financial factors like market share and customer satisfaction.
8.7. Missing Context on Ratios
They provide numerical changes but do not directly calculate financial ratios, which offer valuable insights into liquidity and profitability.
8.8. Different Company Sizes
Comparing balance sheets of vastly different-sized companies can lead to skewed conclusions.
8.9. Non-Standardized Formats
Variations in the presentation of balance sheets due to non-standardized formats can complicate the comparison process.
9. Tips for Practical Comparative Balance Sheet Analysis
Effective analysis requires a systematic approach and attention to detail. Here are some tips to enhance your study and derive valuable insights.
9.1. Ensure Consistent Accounting Policies
Ensure your company consistently applies accounting policies across periods before conducting a comparative analysis.
9.2. Adjust for Inflation and Currency Changes
Consider adjusting the financial data for inflation or currency changes to make meaningful comparisons.
9.3. Calculate Financial Ratios
Complement the analysis with essential financial ratios to provide deeper insights into the company’s financial performance.
9.4. Focus on Percentage Changes
Pay close attention to percentage changes in each line item to identify trends and anomalies.
9.5. Consider Seasonal Variations
If your business experiences seasonal fluctuations, consider the impact on the comparative sheet.
9.6. Analyze Working Capital and Cash Flow
Examine working capital trends and changes in operating cash flows to gauge short-term liquidity and operational efficiency.
9.7. Seek External Context
Supplement your analysis with external context, like industry trends and market conditions.
9.8. Use Charts and Graphs
Visual representations like charts and graphs can simplify complex data and make trends more apparent.
9.9. Benchmark Against Peers
Compare the company’s comparative balance sheet with its competitors or industry peers.
9.10. Consult Financial Experts
Seek guidance from financial experts or professional accountants if you encounter complex financial data.
10. How Does a Comparative Balance Sheet Help With Organizational Growth?
The comparative balance sheet is vital in facilitating and supporting organizational growth in several ways.
10.1. Tracking Financial Progress
As your company expands, it is essential to monitor the financial progress by assessing the impact of business strategies on the company’s financial position.
10.2. Identifying Growth Opportunities
Comparative balance sheets highlight trends and patterns in financial data, enabling you to identify areas experiencing significant growth or showing potential for expansion.
10.3. Optimizing Resource Allocation
Analyzing the comparative balance sheet helps identify areas where resources might be underutilized or overextended, enabling strategic reallocation to support growth initiatives.
10.4. Assessing Financial Health
The comparative balance sheet aids in assessing a company’s financial health by comparing key metrics like liquidity and solvency.
10.5. Understanding Capital Structure
Comparative balance sheets help understand the company’s capital structure, including debt levels and equity financing, which is crucial for making informed decisions about raising capital.
10.6. Analyzing Efficiency and Productivity
To grow effectively, your company must enhance its operational efficiency and productivity, tracked through KPIs like inventory turnover or accounts receivable days.
10.7. Enhancing Investor Confidence
Investors and stakeholders are more likely to support your company’s growth initiatives when they have clear insights into its financial performance.
10.8. Facilitating Strategic Planning
The comparative balance sheet serves as a valuable input for strategic planning sessions, enabling you to set realistic goals and establish growth targets.
11. FAQs About Comparative Balance Sheets
11.1. What is a balance sheet?
A balance sheet displays a company’s financial position, presenting its assets, liabilities, and shareholders’ equity. It showcases what the company owns and owes.
11.2. What is meant by a comparative statement?
A comparative statement presents data from different accounting periods side by side, allowing for a comparison of financial information over time.
11.3. What is the purpose of preparing a comparative balance sheet?
Preparing a comparative balance sheet helps understand changes in a company’s financial position over time, identifying trends, strengths, weaknesses, and growth opportunities.
11.4. How is a comparative balance sheet different from a regular balance sheet?
A comparative balance sheet presents data from two or more periods side by side for comparison, while a regular balance sheet is a single snapshot of a company’s financial position at a specific date.
11.5. What is a comparative income statement and balance sheet?
A comparative income statement presents revenue, expenses, and net income for multiple periods, enabling a comparison of financial performance over time, while a comparative balance sheet compares a company’s financial position across different accounting periods.
11.6. How can I interpret a comparative balance sheet effectively?
To interpret effectively, focus on percentage changes, identify trends, analyze critical ratios, consider external factors, and benchmark against industry peers.
11.7. What is called a comparative statement?
A comparative statement is a financial statement, like a balance sheet or income statement, presenting data from multiple periods side by side for comparison and analysis.
11.8. What are the objectives of a comparative balance sheet?
The objectives are to track financial progress, identify growth opportunities, assess financial health, optimize resource allocation, and enhance investor confidence.
Conclusion: Mastering the Comparative Balance Sheet
The comparative balance sheet is a fundamental financial tool providing insights into a company’s financial health and performance. By understanding its components, formulas, advantages, and limitations, businesses can effectively analyze their financial position, make informed decisions, and drive organizational growth.
Ready to take control of your financial analysis? Visit COMPARE.EDU.VN for more detailed guides and tools to help you master the comparative balance sheet. Make informed decisions and drive your business toward sustainable growth today! Our comprehensive resources provide you with the knowledge and insights you need to succeed. Contact us at 333 Comparison Plaza, Choice City, CA 90210, United States, or reach out via WhatsApp at +1 (626) 555-9090 for personalized assistance. Let compare.edu.vn be your partner in financial success.