Comparing qualitative and quantitative data is crucial for comprehensive insights, and this guide from COMPARE.EDU.VN provides a clear roadmap. By understanding the strengths and limitations of each approach, you can make informed decisions and gain a holistic view. Learn how to effectively evaluate these data types and enhance your decision-making process with data analysis and research methods.
1. Understanding the Fundamentals of Data: Qualitative vs. Quantitative
What are qualitative and quantitative data, and what distinguishes them?
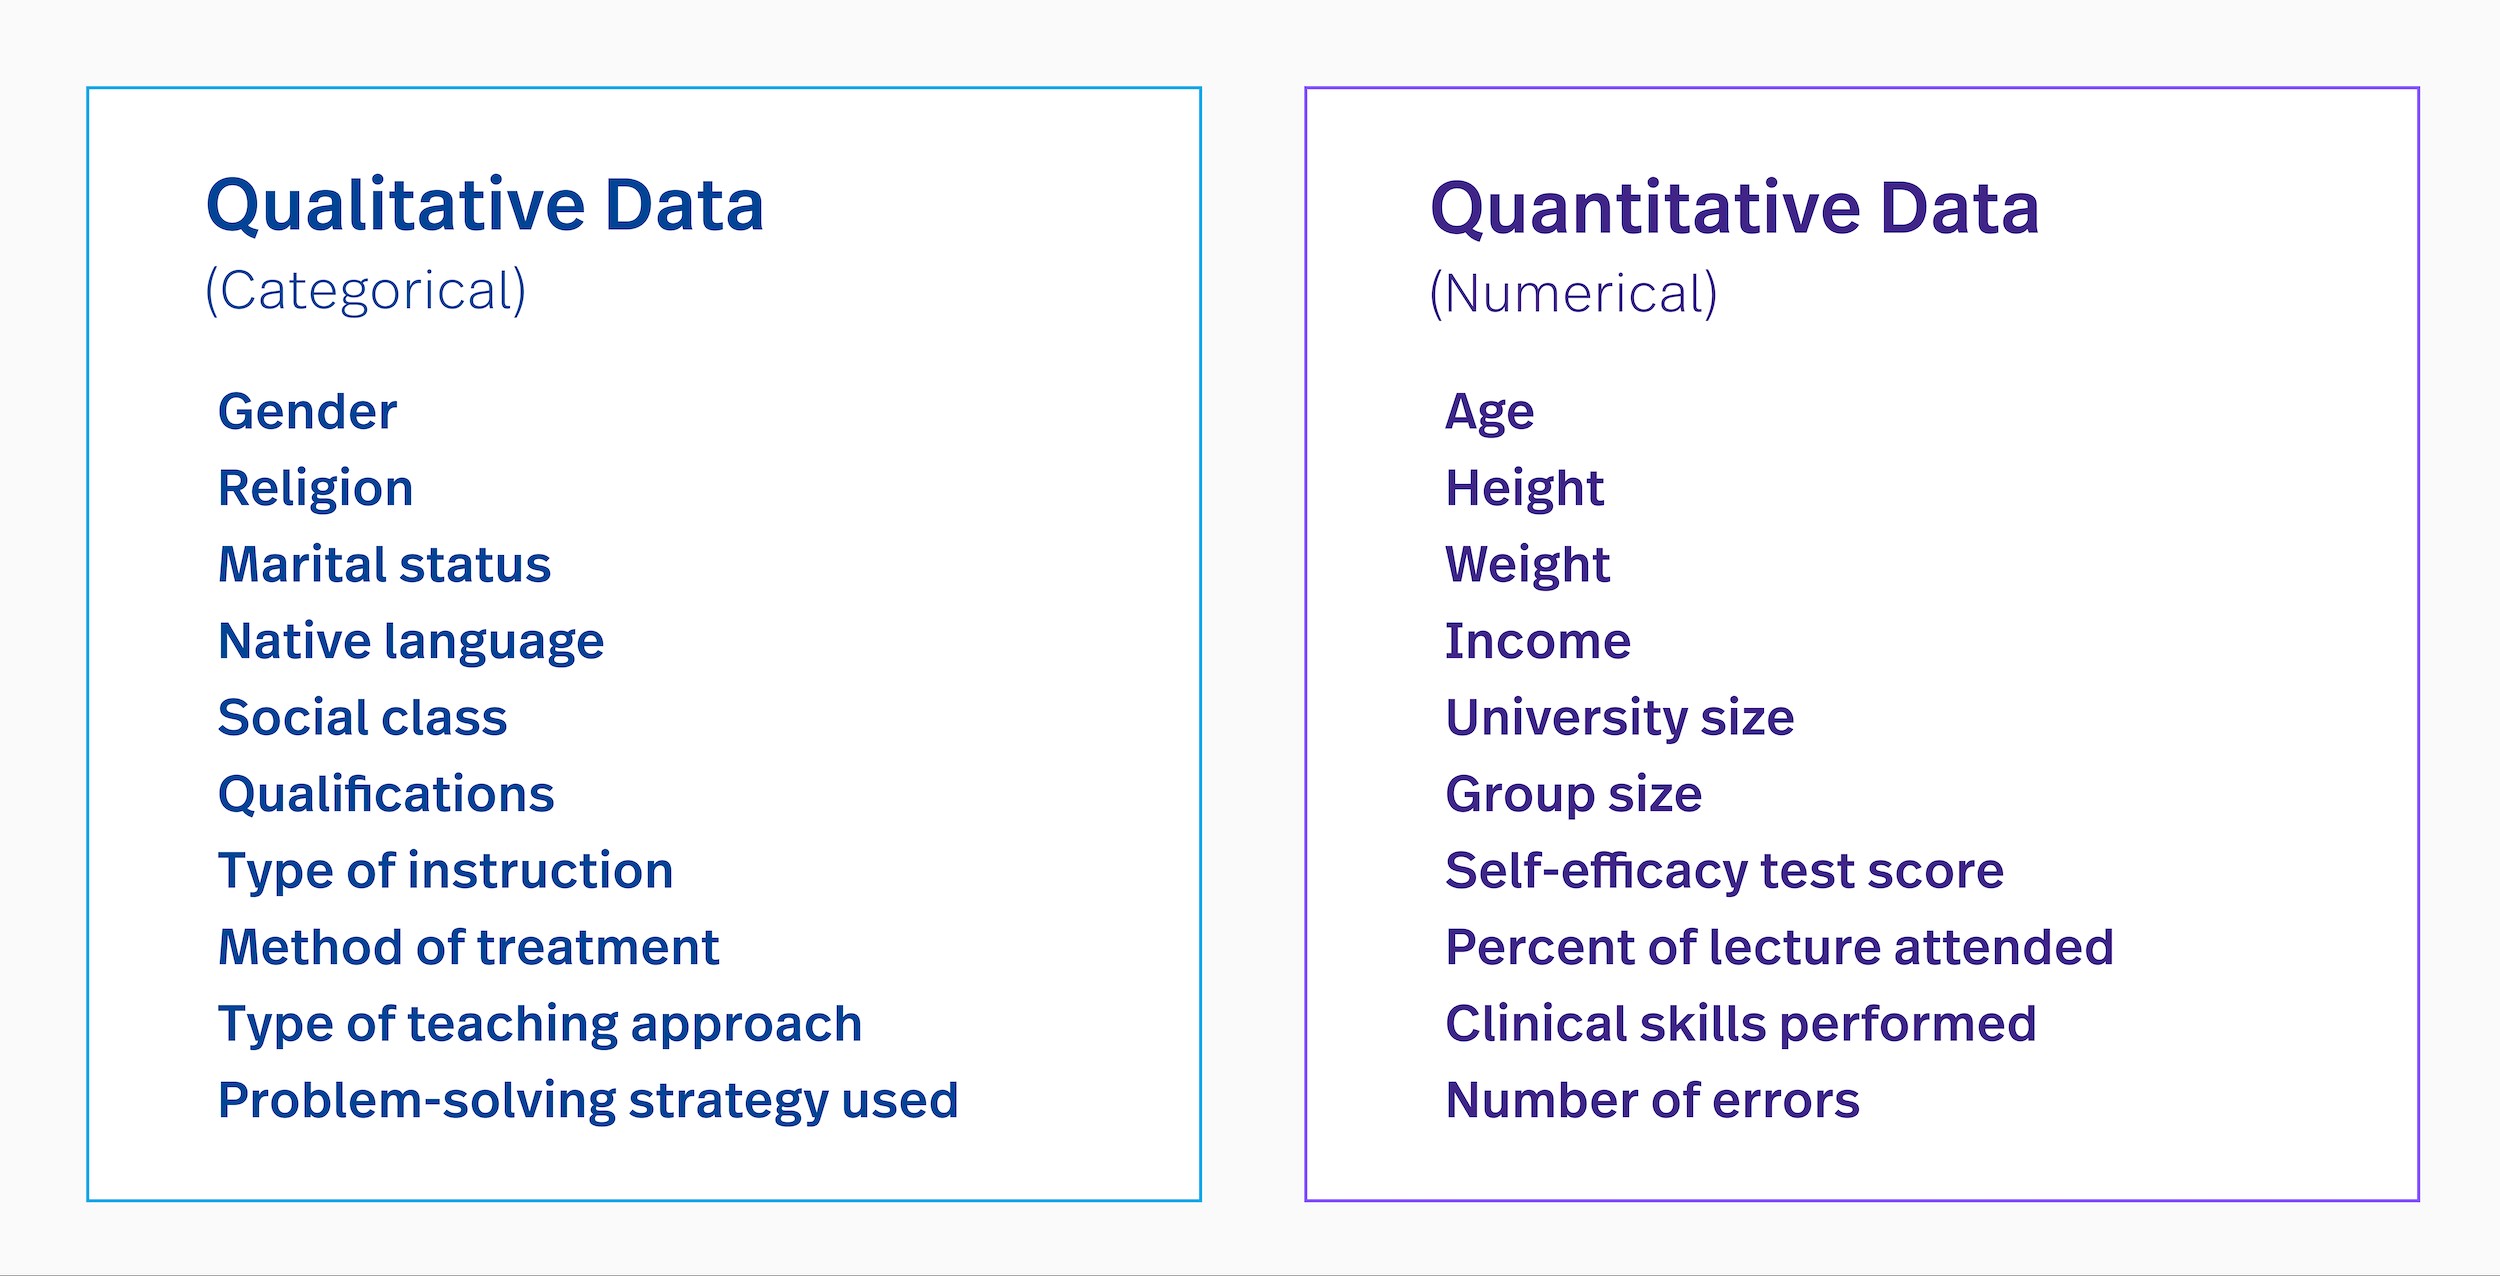
Quantitative data revolves around numbers and measurements, providing insights into “how many” or “how much”. Qualitative data focuses on descriptions and characteristics, answering “why” and “how”. Quantitative data is numerical and measurable, while qualitative data is descriptive and interpretive. Understanding this distinction is vital for choosing the right data collection and analysis methods.
Quantitative data is information that can be counted or measured and given a numerical value. It answers questions like “how many,” “how much,” or “how often.” Examples include the number of website visitors, revenue figures, and frequency of customer interactions. Qualitative data, on the other hand, is descriptive and cannot be measured or counted. It answers questions like “why” and “how,” capturing characteristics and traits through words or labels. Examples include customer feedback, interview transcripts, and observational notes. According to a study by the University of California, Berkeley, combining both data types provides a more comprehensive understanding of complex phenomena, enhancing the depth and reliability of research findings.
 Qualitative vs Quantitative Data
2. Key Differences Between Qualitative and Quantitative Data
What are the primary distinctions between qualitative and quantitative data collection and analysis?
The main differences lie in the approach, type of data collected, and analysis methods used. Quantitative data is numbers-based and analyzed using statistical methods, while qualitative data is interpretation-based and analyzed by categorizing information into themes. Quantitative data is fixed and universal, whereas qualitative data is subjective and unique. Knowing these distinctions helps in choosing appropriate research methods.
| Feature | Quantitative Data | Qualitative Data |
|---|---|---|
| Nature | Numbers-based, countable, measurable | Interpretation-based, descriptive, language-related |
| Questions Answered | How many, how much, how often | Why, how, what |
| Scope | Fixed and universal | Subjective and unique |
| Research Methods | Measuring and counting | Interviewing and observing |
| Analysis Techniques | Statistical analysis | Categorizing data into themes |
3. Examples of Qualitative and Quantitative Data in Practice
Can you provide real-world examples of both qualitative and quantitative data?
Quantitative data examples include the number of clicks on a button, the number of support tickets resolved, and the quantity of products purchased. Qualitative data examples include descriptions of customer experiences, observations of user behavior, and feedback on product features. These examples illustrate how each data type provides different but valuable insights.
Quantitative Data Examples:
- A customer clicked a button 13 times.
- An engineer resolved 34 support tickets today.
- A team completed 7 upgrades this month.
- 14 cartons of eggs were purchased this month.
Qualitative Data Examples:
- A manager has curly brown hair and blue eyes.
- A coworker is funny, loud, and a good listener.
- A customer has a very friendly face and a contagious laugh.
- The eggs were delicious.
According to research conducted by the University of Michigan, integrating these data types offers a comprehensive understanding, allowing businesses to tailor their strategies more effectively.
4. Addressing Bias in Qualitative and Quantitative Data
How can you mitigate bias in both qualitative and quantitative data collection and analysis?
Addressing bias involves using careful sampling methods in quantitative studies and employing strategies like triangulation and reflexivity in qualitative research. Acknowledging and minimizing bias enhances the validity and reliability of research findings. Transparency about potential limitations is also essential for maintaining credibility.
To address bias:
- Use careful sampling methods in quantitative studies.
- Employ strategies like triangulation and reflexivity in qualitative research.
- Consider mixed methods approaches when possible.
- Be transparent about potential limitations in your research.
According to a study by Stanford University, actively addressing bias leads to more accurate and useful insights, improving the quality of research outcomes.
5. Advantages and Disadvantages of Quantitative Data
What are the pros and cons of using quantitative data in research?
Advantages:
- Quick and easy to collect.
- Easier to draw conclusions.
- Statistical tests are straightforward to apply.
- Interpreting and presenting findings is less subjective.
- Replicating studies is possible.
Disadvantages:
- Doesn’t always tell the full story.
- Can be inconclusive with limited information.
- May overlook broader themes and relationships.
- Risk of missing larger focus information.
6. Advantages and Disadvantages of Qualitative Data
What are the benefits and drawbacks of using qualitative data in research?
Advantages:
- Offers rich, in-depth insights.
- Allows exploration of context.
- Great for exploratory purposes.
- Delivers a predictive element for continuous data.
Disadvantages:
- Not statistically representative.
- Relies on the experience of the host.
- Can require multiple data sessions, leading to misleading conclusions.
7. The Role of Quantitative Research
What is quantitative research, and when should it be used?
Quantitative research involves collecting and interpreting numeric data to measure and generalize results. It’s used to uncover patterns and facts, providing a broad overview that can be generalized to larger populations. Behavioral data, such as click rates and time on site, is commonly used in quantitative research.
Examples:
- What is the amount of money invested into this service?
- What is the average number of times a button was dead clicked?
- How many customers are actually clicking this button?
According to research from Harvard University, quantitative research offers more objective findings based on reliable numeric data.
8. Quantitative Data Collection Methods
What are the common methods for collecting quantitative data?
Common methods include:
- Surveys: Questioning a large group of people with closed-ended questions.
- Polls: Gathering numeric responses from a number of people.
- Experiments: Using a control group and an experimental group to manipulate conditions.
9. The Role of Qualitative Research
What is qualitative research, and when is it most effective?
Qualitative research focuses on understanding the qualities of users and the reasons behind their actions. It’s descriptive research that utilizes interviews, focus groups, and observations to gather in-depth insights. It is most effective when exploring ideas or uncovering deep insights rather than quantifying elements.
Examples:
- The sunflowers had a fresh smell that filled the office.
- All the bagels with bites taken out of them had cream cheese.
- The man had blonde hair with a blue hat.
Qualitative research gives a chance to understand the trends and meanings of natural actions. It’s flexible and iterative.
10. Qualitative Data Collection Methods
What are the common methods for collecting qualitative data?
Common methods include:
- Interviews: Personal interaction with a participant to explore attitudes and opinions.
- Focus groups: Guiding a group of participants to share their opinions and experiences on a specific topic.
11. Choosing Between Qualitative and Quantitative Data
How do you decide whether to use qualitative or quantitative data for your analysis?
Quantitative data is structured and accountable, making it ideal for organizing and searching. Qualitative data is unstructured and subjective, making it valuable for personalized insights but less reliable on its own. Using both qualitative and quantitative data yields the best results for a complete statistical analysis.
Quantitative data is preferred for data analysis because it is more concrete, while qualitative data offers valuable context and depth. By combining both, you can achieve a comprehensive understanding of your subject matter.
12. Integrating Qualitative and Quantitative Data for Comprehensive Insights
How can combining qualitative and quantitative data lead to more comprehensive insights?
Combining both data types allows for a more holistic understanding, addressing both “what” and “why.” Quantitative data provides a broad overview, while qualitative data adds depth and context. This integration enhances the reliability and validity of research findings, leading to more informed decisions.
For example, A/B testing can complement both approaches by allowing teams to test quantitative outcomes of different variants while gathering qualitative insights from user feedback on why certain variations perform better.
13. Using Qualitative Data to Enhance Quantitative Analysis
How can qualitative data enhance quantitative analysis?
Qualitative data can provide context to the numbers obtained through quantitative analysis. It can help explain the reasons behind trends and patterns, offering a deeper understanding of the data. This combination allows for more nuanced and actionable insights.
14. Leveraging Quantitative Data to Validate Qualitative Findings
How can quantitative data validate qualitative findings?
Quantitative data can confirm or refute the insights gained from qualitative research. By measuring the frequency or extent of certain phenomena, quantitative data can provide empirical evidence to support qualitative findings. This validation strengthens the credibility of the research.
15. Tools and Techniques for Analyzing Qualitative Data
What tools and techniques are available for analyzing qualitative data?
Tools and techniques include:
- Thematic analysis: Identifying recurring themes and patterns in the data.
- Content analysis: Systematically analyzing the content of text or media.
- Narrative analysis: Examining the stories and experiences shared by participants.
- Grounded theory: Developing theories based on the data collected.
16. Statistical Methods for Analyzing Quantitative Data
What statistical methods are commonly used for analyzing quantitative data?
Common statistical methods include:
- Descriptive statistics: Summarizing and describing the data.
- Inferential statistics: Making inferences and generalizations about a population based on a sample.
- Regression analysis: Examining the relationship between variables.
- Hypothesis testing: Testing specific hypotheses about the data.
17. Case Studies: Successful Integration of Qualitative and Quantitative Data
Can you share examples of successful case studies that integrated both data types?
Numerous case studies demonstrate the successful integration of qualitative and quantitative data across various fields. For instance, in marketing, companies often combine survey data (quantitative) with focus group feedback (qualitative) to refine advertising campaigns. In healthcare, researchers might use statistical analysis (quantitative) alongside patient interviews (qualitative) to understand treatment outcomes and patient experiences comprehensively. A study by McKinsey highlights that companies integrating data-driven insights from both qualitative and quantitative sources are 23 times more likely to outperform their competitors.
18. Common Pitfalls to Avoid When Comparing Data
What are the common mistakes to avoid when comparing qualitative and quantitative data?
Common pitfalls include:
- Ignoring context: Failing to consider the context in which the data was collected.
- Overgeneralizing: Making broad generalizations based on limited data.
- Ignoring bias: Failing to address potential biases in the data.
- Misinterpreting data: Drawing incorrect conclusions from the data.
- Neglecting data quality: Not ensuring the accuracy and reliability of the data.
According to a report by Deloitte, avoiding these pitfalls is crucial for ensuring the integrity and usefulness of data analysis.
19. Ethical Considerations in Data Collection and Analysis
What ethical considerations should be taken into account when collecting and analyzing data?
Ethical considerations include:
- Informed consent: Ensuring participants are fully informed about the research and consent to participate.
- Privacy: Protecting the privacy and confidentiality of participants.
- Anonymity: Ensuring participants cannot be identified from the data.
- Data security: Protecting the data from unauthorized access or use.
- Transparency: Being transparent about the methods and findings of the research.
Following these ethical guidelines helps ensure that research is conducted responsibly and with respect for participants.
20. Future Trends in Qualitative and Quantitative Data Analysis
What are the emerging trends in qualitative and quantitative data analysis?
Emerging trends include:
- Artificial intelligence (AI): Using AI to automate and enhance data analysis.
- Big data: Analyzing large and complex datasets.
- Data visualization: Using visual representations to communicate data insights.
- Mixed methods research: Combining qualitative and quantitative methods in innovative ways.
- Real-time data analysis: Analyzing data in real-time to make timely decisions.
These trends are transforming the field of data analysis, offering new opportunities for generating insights and driving innovation.
21. How COMPARE.EDU.VN Can Help You Compare Data Effectively
How can COMPARE.EDU.VN assist in comparing qualitative and quantitative data?
COMPARE.EDU.VN offers comprehensive resources and tools to help you compare data effectively. Our platform provides detailed comparisons, clear advantages and disadvantages, and expert advice to guide your decisions. We make it easy to find the information you need to make informed choices, saving you time and effort.
COMPARE.EDU.VN is your go-to source for objective comparisons and detailed insights, ensuring you have the knowledge to succeed. Our platform is designed to help you overcome the challenges of comparing data, offering:
- Detailed comparisons: Clear and concise breakdowns of qualitative and quantitative data.
- Advantages and disadvantages: A balanced view of the strengths and weaknesses of each data type.
- Expert advice: Guidance from experienced professionals to help you make informed decisions.
22. Real-World Applications of Comparing Qualitative and Quantitative Data
Where can you apply the knowledge of comparing qualitative and quantitative data in real-world scenarios?
The ability to compare qualitative and quantitative data is valuable in various fields, including:
- Business: Making informed decisions about product development, marketing, and customer service.
- Healthcare: Improving patient care and treatment outcomes.
- Education: Enhancing teaching methods and student performance.
- Social sciences: Understanding social phenomena and developing effective interventions.
By applying the principles outlined in this guide, you can make more informed decisions and achieve better outcomes in your respective field.
23. Common Challenges Faced When Comparing Data
What are some common difficulties encountered when comparing qualitative and quantitative data?
Some common challenges include:
- Data integration: Combining data from different sources and formats.
- Data interpretation: Making sense of complex and conflicting data.
- Data quality: Ensuring the accuracy and reliability of the data.
- Resource constraints: Limited time, budget, and expertise.
- Communication barriers: Effectively communicating data insights to stakeholders.
Addressing these challenges requires careful planning, collaboration, and the use of appropriate tools and techniques.
24. Maximizing the Value of Data Comparison for Decision-Making
How can you ensure that comparing data leads to better decision-making?
To maximize the value of data comparison:
- Define clear objectives: Identify the specific goals and questions you want to address.
- Select appropriate methods: Choose the right data collection and analysis methods for your objectives.
- Ensure data quality: Verify the accuracy and reliability of the data.
- Consider context: Take into account the context in which the data was collected.
- Communicate effectively: Clearly communicate your findings and recommendations to stakeholders.
By following these guidelines, you can leverage data comparison to make more informed and effective decisions.
25. Best Practices for Presenting Data Comparisons
What are the best practices for presenting data comparisons to an audience?
When presenting data comparisons:
- Use clear and concise language: Avoid jargon and technical terms.
- Use visuals: Use charts, graphs, and other visuals to illustrate your findings.
- Tell a story: Frame your data in a compelling narrative that engages your audience.
- Highlight key insights: Focus on the most important findings and their implications.
- Provide recommendations: Offer clear and actionable recommendations based on your data.
By following these best practices, you can effectively communicate your data comparisons and influence decision-making.
26. Understanding Data Analysis in Different Contexts
How does data analysis differ across various contexts and industries?
Data analysis varies significantly across industries due to different objectives, data types, and regulatory environments. For example, in healthcare, data analysis focuses on improving patient outcomes and reducing costs, while in marketing, it aims to enhance customer engagement and drive sales.
Different contexts also require different analytical techniques. In finance, regression analysis and time series forecasting are common, while in social sciences, qualitative coding and thematic analysis are frequently used.
27. The Importance of Continuous Learning in Data Analysis
Why is continuous learning essential for professionals in data analysis?
The field of data analysis is constantly evolving, with new tools, techniques, and technologies emerging regularly. Continuous learning is essential for professionals to stay current with these advancements and maintain their competitive edge.
Continuous learning also helps professionals adapt to changing business needs and solve new challenges effectively. By investing in their skills and knowledge, data analysts can deliver greater value to their organizations and advance their careers.
28. Resources for Further Learning in Data Analysis
What resources are available for professionals looking to expand their knowledge in data analysis?
Numerous resources are available for further learning, including:
- Online courses: Platforms like Coursera, Udemy, and edX offer a wide range of courses in data analysis.
- Books: Numerous books cover various aspects of data analysis, from introductory concepts to advanced techniques.
- Conferences: Industry conferences provide opportunities to learn from experts and network with peers.
- Professional organizations: Organizations like the Data Science Association offer resources, training, and certification programs.
By leveraging these resources, professionals can continuously expand their knowledge and skills in data analysis.
29. How to Build a Strong Foundation in Data Analysis
What steps can you take to build a strong foundation in data analysis?
To build a strong foundation:
- Develop a solid understanding of statistics: Statistics is the foundation of data analysis.
- Learn programming languages: Proficiency in languages like Python and R is essential.
- Master data visualization tools: Tools like Tableau and Power BI help communicate insights effectively.
- Gain practical experience: Work on real-world projects to apply your knowledge and skills.
- Continuously learn and adapt: Stay current with the latest trends and technologies in the field.
By following these steps, you can build a strong foundation and succeed in the field of data analysis.
30. The Impact of Technology on Data Analysis Methods
How has technology transformed the methods and capabilities of data analysis?
Technology has revolutionized data analysis, making it faster, more efficient, and more accessible. Cloud computing enables analysts to process large datasets and collaborate remotely, while machine learning automates tasks such as data cleaning and pattern recognition. Advanced data visualization tools allow for the creation of interactive dashboards, making complex data more understandable to stakeholders. Overall, technology has expanded the scope and depth of data analysis, driving innovation and better decision-making. According to a recent report by Gartner, the adoption of AI and machine learning in data analytics is expected to double by 2025, further enhancing analytical capabilities.
Ready to dive deeper into the world of data comparison? Visit COMPARE.EDU.VN today to explore our comprehensive resources and make informed decisions with confidence. For further assistance, contact us at 333 Comparison Plaza, Choice City, CA 90210, United States, or reach out via WhatsApp at +1 (626) 555-9090. Let compare.edu.vn be your guide to smarter, data-driven choices.
FAQ: Comparing Qualitative and Quantitative Data
Q1: What is the main difference between qualitative and quantitative data?
The primary difference is that quantitative data deals with numbers and measurements, while qualitative data deals with descriptions and characteristics. Quantitative data answers “how many” or “how much,” while qualitative data answers “why” and “how.” This distinction is fundamental in research and analysis.
Q2: When should I use qualitative data over quantitative data?
Use qualitative data when you need in-depth insights into people’s attitudes, behaviors, or experiences. It’s best for exploring ideas, understanding context, and uncovering underlying reasons. Qualitative research provides rich, descriptive information that numbers alone cannot capture.
Q3: Can qualitative and quantitative data be used together?
Yes, combining qualitative and quantitative data can provide a more comprehensive understanding. Quantitative data can provide a broad overview and measure the extent of something, while qualitative data can add depth and context by explaining why something is happening. This mixed-methods approach enhances the reliability and validity of research findings.
Q4: What are some common methods for collecting qualitative data?
Common methods for collecting qualitative data include interviews, focus groups, and observations. Interviews involve personal interaction to explore attitudes and opinions. Focus groups gather opinions and experiences from a group on a specific topic. Observations involve watching and recording behaviors in a natural setting.
Q5: What are some common methods for collecting quantitative data?
Common methods for collecting quantitative data include surveys, polls, and experiments. Surveys involve questioning a large group of people with closed-ended questions. Polls gather numeric responses from a number of people. Experiments use a control group and an experimental group to manipulate conditions and measure results.
Q6: How do I analyze qualitative data?
Analyzing qualitative data involves identifying recurring themes and patterns, systematically analyzing text or media content, examining stories and experiences, and developing theories based on the data collected. Tools like thematic analysis and content analysis can help structure and interpret the data.
Q7: What statistical methods are used to analyze quantitative data?
Common statistical methods for analyzing quantitative data include descriptive statistics, inferential statistics, regression analysis, and hypothesis testing. Descriptive statistics summarize and describe the data. Inferential statistics make inferences about a population based on a sample. Regression analysis examines relationships between variables. Hypothesis testing tests specific claims about the data.
Q8: How can I mitigate bias in qualitative and quantitative data?
To mitigate bias, use careful sampling methods in quantitative studies and employ strategies like triangulation and reflexivity in qualitative research. Acknowledge potential limitations and be transparent about your methods. This helps ensure the validity and reliability of your findings.
Q9: What are the ethical considerations in data collection and analysis?
Ethical considerations include obtaining informed consent, protecting privacy and confidentiality, ensuring anonymity, securing data, and being transparent about methods and findings. Adhering to these principles ensures responsible and respectful research practices.
Q10: Where can I find reliable resources for learning more about data analysis?
You can find reliable resources on platforms like Coursera, Udemy, and edX, which offer online courses in data analysis. Numerous books cover various aspects of data analysis. Industry conferences provide learning and networking opportunities. Professional organizations like the Data Science Association offer resources and training programs.