Comparing multiple columns in Excel can be a daunting task, but with the right approach, it can be streamlined for efficient data analysis. COMPARE.EDU.VN offers expert guidance to help you master this skill. This guide provides detailed methods, formulas, and step-by-step instructions on how to effectively compare columns, identify matching or differing data, and gain valuable insights from your spreadsheets. By leveraging techniques like array formulas and conditional formatting, you can unlock the full potential of Excel for data comparison, empowering informed decision-making. This guide also explores advanced comparison techniques and third-party tools, enhancing your data analysis capabilities.
Table of Contents
1. Understanding the Basics of Column Comparison in Excel
- 1.1 Why Compare Multiple Columns?
- 1.2 Basic Comparison Techniques
- 1.3 Limitations of Manual Comparison
2. Using Formulas for Column Comparison
- 2.1 The
IFFunction - 2.2 The
COUNTIFFunction - 2.3 The
MATCHFunction - 2.4 The
SUMPRODUCTFunction
3. Advanced Formula Techniques for Complex Comparisons
- 3.1 Comparing Columns with Different Lengths
- 3.2 Handling Case Sensitivity
- 3.3 Ignoring Whitespace and Special Characters
4. Array Formulas for Efficient Multi-Column Comparison
- 4.1 Understanding Array Formulas
- 4.2 Creating a Comparison Matrix
- 4.3 Applying the Array Formula
- 4.4 Customizing the Comparison Matrix
5. Conditional Formatting for Visual Column Comparison
- 5.1 Highlighting Matching Values
- 5.2 Highlighting Differences
- 5.3 Using Color Scales for Gradual Differences
- 5.4 Managing Conditional Formatting Rules
6. Using Excel’s Built-in Comparison Tools
- 6.1 The “Find and Select” Feature
- 6.2 The “Go To Special” Feature
- 6.3 Removing Duplicate Values
7. Power Query for Advanced Data Comparison and Transformation
- 7.1 Importing Data into Power Query
- 7.2 Merging Columns
- 7.3 Comparing Tables with Power Query
8. VBA for Customized Column Comparison
- 8.1 Introduction to VBA in Excel
- 8.2 Writing a Simple Comparison Macro
- 8.3 Advanced VBA Techniques
9. Third-Party Tools and Add-Ins for Excel Comparison
- 9.1 Overview of Available Tools
- 9.2 Features and Benefits
- 9.3 Integration with Excel
10. Best Practices for Column Comparison in Excel
- 10.1 Data Preparation and Cleaning
- 10.2 Ensuring Data Consistency
- 10.3 Documenting Your Comparison Process
11. Real-World Examples of Column Comparison
- 11.1 Comparing Sales Data
- 11.2 Comparing Inventory Lists
- 11.3 Comparing Customer Databases
12. Common Issues and Troubleshooting
- 12.1 Formula Errors
- 12.2 Performance Issues
- 12.3 Data Type Mismatches
13. Optimizing Your Excel Skills for Data Comparison
- 13.1 Keyboard Shortcuts
- 13.2 Customizing the Excel Interface
- 13.3 Using Excel Templates
14. The Future of Data Comparison in Excel
- 14.1 Integration with AI and Machine Learning
- 14.2 Cloud-Based Solutions
- 14.3 Enhanced Visualization Tools
15. Conclusion: Leveraging Excel for Effective Data Analysis
1. Understanding the Basics of Column Comparison in Excel
1.1 Why Compare Multiple Columns?
Comparing multiple columns in Excel is a fundamental skill for data analysis, decision-making, and maintaining data integrity. Whether you’re analyzing sales figures, managing inventory, or reconciling financial statements, the ability to compare data across columns efficiently is crucial. Column comparison allows you to identify patterns, discrepancies, and trends that would otherwise be difficult to detect. For example, you might want to compare two columns of customer data to identify duplicates or inconsistencies in contact information. Or, you could compare columns of sales data to track performance across different regions or time periods. This capability is vital for data accuracy and informed decision-making.
1.2 Basic Comparison Techniques
At its most basic, column comparison involves visually inspecting data in two or more columns to identify similarities and differences. However, manual comparison is time-consuming and prone to errors, especially with large datasets. A more effective approach is to use Excel’s built-in features, such as formulas and conditional formatting, to automate the comparison process. Simple formulas like =IF(A1=B1, "Match", "No Match") can quickly identify matching and non-matching values in corresponding rows. Conditional formatting can highlight these matches or differences, making them visually apparent. These techniques provide a starting point for more complex analyses.
1.3 Limitations of Manual Comparison
While manual comparison and basic formulas can be useful for small datasets, they quickly become impractical for larger or more complex data. Manual comparison is not only time-consuming but also highly susceptible to human error. Basic formulas, while helpful, often lack the flexibility to handle more nuanced comparisons, such as those involving case sensitivity, partial matches, or comparisons across multiple criteria. These limitations underscore the need for more advanced techniques, such as array formulas, Power Query, and VBA, to efficiently and accurately compare multiple columns in Excel.
2. Using Formulas for Column Comparison
2.1 The IF Function
The IF function is one of the most basic yet powerful tools for column comparison in Excel. It allows you to perform a logical test and return one value if the test is true and another value if the test is false. For column comparison, the logical test typically involves comparing the values in corresponding rows of two or more columns. For example, the formula =IF(A1=B1, "Match", "No Match") compares the values in cell A1 and B1. If they are equal, the formula returns “Match”; otherwise, it returns “No Match”. You can drag this formula down to apply it to the entire column, quickly identifying matching and non-matching values.
2.2 The COUNTIF Function
The COUNTIF function counts the number of cells within a range that meet a given criteria. When used for column comparison, COUNTIF can determine how many times a value in one column appears in another column. For example, if you want to see how many values in column A also appear in column B, you can use the formula =COUNTIF(B:B, A1). This formula counts how many times the value in cell A1 appears in column B. If the result is greater than 0, it means the value exists in column B. This is particularly useful for identifying common elements between two lists.
2.3 The MATCH Function
The MATCH function searches for a specified item in a range of cells and returns the relative position of that item in the range. This function is invaluable for determining whether a value in one column exists in another column and, if so, where it is located. For example, the formula =MATCH(A1, B:B, 0) searches for the value in cell A1 within column B. The 0 indicates an exact match. If the value is found, the formula returns its position in column B; otherwise, it returns an error (#N/A). This allows you to quickly identify if a value from one column is present in another and its location.
2.4 The SUMPRODUCT Function
The SUMPRODUCT function multiplies corresponding components in the given arrays and returns the sum of those products. This function can be used for more complex column comparisons, especially when you need to compare multiple criteria. For instance, if you want to count the number of rows where both column A and column B match corresponding values in columns C and D, you can use the formula =SUMPRODUCT((A1:A10=C1:C10)*(B1:B10=D1:D10)). This formula checks each row to see if A equals C and B equals D. If both conditions are true, it multiplies the result by 1; otherwise, it multiplies by 0. The SUMPRODUCT then sums these results, giving you the total number of rows that meet both criteria. This is a versatile function for advanced comparison scenarios.
3. Advanced Formula Techniques for Complex Comparisons
3.1 Comparing Columns with Different Lengths
When comparing columns of different lengths, standard formulas like IF and MATCH may not work as expected. To handle this, you can use a combination of formulas to ensure all values in the shorter column are compared against the longer column. One approach is to use the ISERROR function in conjunction with MATCH. For example, if column A is shorter than column B, you can use the formula =IF(ISERROR(MATCH(A1, B:B, 0)), "Not Found", "Found"). This formula checks if the value in A1 is found in column B. If MATCH returns an error (meaning the value is not found), ISERROR returns TRUE, and the IF function returns “Not Found”. Otherwise, it returns “Found”. This ensures that every value in the shorter column is checked against the longer column.
3.2 Handling Case Sensitivity
Excel formulas are generally case-insensitive, meaning “Apple” and “apple” are considered the same. If you need to perform a case-sensitive comparison, you can use the EXACT function. The EXACT function compares two strings and returns TRUE if they are exactly the same, including case, and FALSE otherwise. For example, the formula =IF(EXACT(A1, B1), "Match", "No Match") compares the values in A1 and B1. If they are identical, including case, the formula returns “Match”; otherwise, it returns “No Match”. This is essential for situations where case matters, such as comparing usernames or product codes.
3.3 Ignoring Whitespace and Special Characters
Whitespace and special characters can cause comparison issues, especially when data is imported from different sources. To address this, you can use the TRIM and SUBSTITUTE functions to clean the data before comparison. The TRIM function removes leading and trailing spaces from a string, while the SUBSTITUTE function can replace specific characters with others (or with nothing, effectively removing them). For example, to compare values in A1 and B1 after removing whitespace, you can use the formula =IF(TRIM(A1)=TRIM(B1), "Match", "No Match"). To remove specific characters, such as hyphens, you can use =IF(SUBSTITUTE(A1, "-", "")=SUBSTITUTE(B1, "-", ""), "Match", "No Match"). By cleaning the data first, you can ensure more accurate comparisons.
4. Array Formulas for Efficient Multi-Column Comparison
4.1 Understanding Array Formulas
Array formulas in Excel allow you to perform calculations on multiple values at once, rather than just single values. These formulas can greatly enhance your ability to compare multiple columns efficiently. An array formula processes a range of cells and returns either a single result or an array of results. To enter an array formula, you must press Ctrl+Shift+Enter instead of just Enter. Excel will then enclose the formula in curly braces {}. Array formulas are particularly useful for complex calculations and comparisons across multiple columns.
4.2 Creating a Comparison Matrix
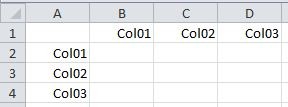
To compare multiple columns using an array formula, you can create a comparison matrix. This involves setting up a grid where each cell represents the comparison between two columns. For example, if you have columns A, B, and C, your matrix would have cells for comparing A vs. B, A vs. C, and B vs. C. Label the rows and columns of the matrix with the column headers to clearly indicate which columns are being compared. This structured approach helps in organizing the comparison process and interpreting the results.
4.3 Applying the Array Formula
Once the comparison matrix is set up, you can apply an array formula to calculate the number of matching values between the columns. Assuming your data starts in row 2 and extends to row 100, and your column headers are in row 1, the following array formula can be used: =SUM(IF(INDIRECT(B$1&"2:"&B$1&"100")=INDIRECT($A2&"2:"&$A2&"100"),1,0)). This formula compares each cell in the range specified by the column header in row 1 (e.g., column B) with the corresponding cell in the range specified by the column header in column A (e.g., column A). The INDIRECT function allows you to use the column headers as range names. The IF function checks if the values are equal, and if so, it returns 1; otherwise, it returns 0. The SUM function then adds up all the 1s, giving you the total number of matching values. Remember to enter this formula by pressing Ctrl+Shift+Enter.
4.4 Customizing the Comparison Matrix
The comparison matrix can be customized to suit your specific needs. For example, you can modify the formula to perform different types of comparisons, such as identifying the number of differences or calculating the percentage of matching values. You can also add conditional formatting to the matrix to visually highlight significant results. For instance, you might want to highlight cells with a high number of matches in green and cells with a low number of matches in red. This customization allows you to tailor the comparison matrix to your particular data analysis requirements.
5. Conditional Formatting for Visual Column Comparison
5.1 Highlighting Matching Values
Conditional formatting is a powerful tool in Excel that allows you to automatically apply formatting to cells based on specified criteria. For column comparison, it can be used to visually highlight matching values, making them easy to identify. To highlight matching values in two columns, select the range of cells you want to compare, go to “Conditional Formatting” in the “Home” tab, choose “New Rule,” and select “Use a formula to determine which cells to format.” Enter a formula like =A1=B1, where A1 is the first cell in the selected range, and choose a formatting style (e.g., a green fill). This will highlight all cells in column A that match the corresponding cells in column B.
5.2 Highlighting Differences
Similarly, conditional formatting can be used to highlight differences between columns. Follow the same steps as above, but use a formula that identifies non-matching values, such as =A1<>B1. Choose a different formatting style (e.g., a red fill) to visually distinguish the differences. This allows you to quickly spot any discrepancies in your data.
5.3 Using Color Scales for Gradual Differences
For more nuanced comparisons, you can use color scales to represent gradual differences between values. This is particularly useful when comparing numerical data. Select the range of cells you want to format, go to “Conditional Formatting,” choose “Color Scales,” and select a color scale that suits your needs (e.g., green-yellow-red). Excel will automatically apply a gradient of colors to the cells based on their values, with higher values appearing in one color and lower values in another. This provides a visual representation of the relative differences between the values.
5.4 Managing Conditional Formatting Rules
As you add more conditional formatting rules to your spreadsheet, it’s important to manage them effectively to avoid conflicts and ensure accurate formatting. You can manage your conditional formatting rules by going to “Conditional Formatting” and selecting “Manage Rules.” This opens a dialog box where you can view, edit, delete, and reorder your rules. Pay attention to the “Applies to” range to ensure that each rule is applied to the correct cells. By carefully managing your conditional formatting rules, you can maintain a clear and informative visual representation of your data.
6. Using Excel’s Built-in Comparison Tools
6.1 The “Find and Select” Feature
Excel’s “Find and Select” feature, located in the “Home” tab, offers several options for locating specific types of data in your spreadsheet. While not specifically designed for column comparison, it can be used to find cells that meet certain criteria, such as those containing specific values or formulas. For example, you can use the “Find” option to search for a particular value in one column and then use the “Select” option to highlight all cells in another column that contain the same value. This can be useful for identifying common elements between two columns.
6.2 The “Go To Special” Feature
The “Go To Special” feature, also found in the “Find and Select” menu, allows you to select cells based on various criteria, such as blanks, constants, formulas, and more. This feature can be particularly useful for identifying differences between columns. For example, you can select two columns and use “Go To Special” to select all cells that contain different formulas or constants. This can help you quickly identify discrepancies in your data.
6.3 Removing Duplicate Values
Excel’s “Remove Duplicates” feature, located in the “Data” tab, is a powerful tool for cleaning and comparing data. It allows you to quickly identify and remove duplicate rows based on the values in one or more columns. Before comparing columns, you can use this feature to ensure that your data is unique and consistent. Select the range of cells you want to analyze, click “Remove Duplicates,” and choose the columns you want to check for duplicates. Excel will then remove any duplicate rows, leaving you with a clean dataset for comparison.
7. Power Query for Advanced Data Comparison and Transformation
7.1 Importing Data into Power Query
Power Query is a powerful data transformation and analysis tool built into Excel that allows you to import data from various sources, clean and transform it, and load it into your spreadsheet. To use Power Query for column comparison, the first step is to import your data into the Power Query Editor. You can do this by going to the “Data” tab and selecting “From Table/Range” if your data is already in an Excel table, or “From Text/CSV” if your data is in a text or CSV file. Power Query supports a wide range of data sources, including databases, web pages, and more.
7.2 Merging Columns
One of the key features of Power Query for column comparison is the ability to merge columns. This allows you to combine data from multiple columns into a single column, which can then be used for comparison. For example, if you have customer data in separate columns for first name and last name, you can merge these columns into a single “Full Name” column. To merge columns, select the columns you want to merge, right-click, and choose “Merge Columns.” You can specify a separator (e.g., a space) to separate the values from the different columns.
7.3 Comparing Tables with Power Query
Power Query also allows you to compare entire tables, identifying matching and non-matching rows. This is particularly useful when comparing data from different sources or time periods. To compare tables, import both tables into Power Query and then use the “Merge Queries” feature to join the tables based on one or more common columns. You can choose different types of joins, such as “Left Outer,” “Right Outer,” or “Inner,” to specify which rows to include in the merged table. After merging the tables, you can add custom columns to compare the values in the corresponding rows and identify differences.
8. VBA for Customized Column Comparison
8.1 Introduction to VBA in Excel
VBA (Visual Basic for Applications) is a programming language built into Excel that allows you to automate tasks and create custom functions. For column comparison, VBA can be used to write macros that perform complex comparisons and transformations that are not possible with standard Excel formulas. To access the VBA editor, press Alt+F11. This opens the VBA Integrated Development Environment (IDE), where you can write and edit your VBA code.
8.2 Writing a Simple Comparison Macro
A simple VBA macro for column comparison might involve looping through the rows of two columns and comparing the values in each row. Here’s an example of a VBA macro that compares the values in column A and column B and writes “Match” or “No Match” in column C:
Sub CompareColumns()
    Dim LastRow As Long, i As Long

    'Find the last row with data in column A
    LastRow = Cells(Rows.Count, "A").End(xlUp).Row

    'Loop through each row
    For i = 1 To LastRow
        'Compare the values in column A and column B
        If Cells(i, "A").Value = Cells(i, "B").Value Then
            'If the values match, write "Match" in column C
            Cells(i, "C").Value = "Match"
        Else
            'If the values don't match, write "No Match" in column C
            Cells(i, "C").Value = "No Match"
        End If
    Next i
End Sub
To use this macro, open the VBA editor, insert a new module (Insert > Module), paste the code into the module, and run the macro by pressing F5 or clicking the “Run” button.
8.3 Advanced VBA Techniques
VBA can be used for more advanced column comparison tasks, such as comparing multiple columns simultaneously, handling case sensitivity, ignoring whitespace, and performing fuzzy matching. For example, you can modify the above macro to compare multiple columns by adding more If statements or using a loop to iterate through the columns. You can also use VBA functions like StrComp to perform case-sensitive comparisons and Trim to remove whitespace. For fuzzy matching, you can use the Like operator or the VLookup function with the False argument to find approximate matches.
9. Third-Party Tools and Add-Ins for Excel Comparison
9.1 Overview of Available Tools
While Excel provides several built-in features for column comparison, third-party tools and add-ins can offer additional functionality and ease of use. These tools often provide more advanced comparison algorithms, better reporting capabilities, and more intuitive user interfaces. Some popular Excel comparison tools include:
- DiffEngineX: A powerful tool for comparing Excel files and spreadsheets, highlighting differences in data, formulas, and formatting.
- Spreadsheet Compare: A Microsoft tool that comes with Office Professional Plus, allowing you to compare two Excel files side by side.
- XL Comparator: An Excel add-in that compares two Excel files and highlights the differences.
- Beyond Compare: A file comparison tool that supports Excel files and provides detailed comparison reports.
9.2 Features and Benefits
Third-party Excel comparison tools offer a range of features and benefits, including:
- Side-by-side comparison: Allows you to view two Excel files or spreadsheets side by side, making it easier to identify differences.
- Highlighting differences: Automatically highlights differences in data, formulas, and formatting, saving you time and effort.
- Detailed reporting: Generates detailed comparison reports that summarize the differences between the files.
- Version control: Helps you track changes to your Excel files over time, making it easier to manage different versions.
- Integration with Excel: Integrates seamlessly with Excel, allowing you to access the comparison tools directly from the Excel interface.
9.3 Integration with Excel
Most third-party Excel comparison tools integrate seamlessly with Excel, either as add-ins or standalone applications that can open and compare Excel files. Add-ins are typically installed directly into Excel and can be accessed from the Excel ribbon. Standalone applications may require you to open the Excel files in the application and then perform the comparison. Regardless of the integration method, these tools can greatly enhance your ability to compare Excel files and spreadsheets efficiently and accurately.
10. Best Practices for Column Comparison in Excel
10.1 Data Preparation and Cleaning
Before comparing columns in Excel, it’s crucial to prepare and clean your data to ensure accurate and reliable results. This involves removing any inconsistencies, errors, or irrelevant data that could skew the comparison. Some common data preparation tasks include:
- Removing duplicate rows: Use Excel’s “Remove Duplicates” feature to eliminate duplicate rows based on one or more columns.
- Correcting spelling errors: Use Excel’s spell checker or manual inspection to correct any spelling errors in your data.
- Standardizing data formats: Ensure that your data is in a consistent format, such as dates, numbers, or text.
- Removing whitespace: Use the
TRIMfunction to remove leading and trailing spaces from your data. - Handling missing values: Decide how to handle missing values, such as replacing them with a default value or excluding them from the comparison.
10.2 Ensuring Data Consistency
In addition to preparing and cleaning your data, it’s also important to ensure data consistency across the columns you’re comparing. This involves verifying that the data is accurate, complete, and up-to-date. Some common data consistency checks include:
- Verifying data types: Ensure that the data types in the columns you’re comparing are compatible. For example, you can’t compare a text column with a number column.
- Checking for outliers: Identify and investigate any outliers in your data that could indicate errors or inconsistencies.
- Validating data ranges: Ensure that your data falls within a valid range of values. For example, you can’t have a negative sales figure.
- Cross-referencing data: Cross-reference your data with other sources to verify its accuracy and completeness.
10.3 Documenting Your Comparison Process
Finally, it’s important to document your column comparison process to ensure that it’s repeatable and auditable. This involves recording the steps you took to prepare and clean your data, the formulas and techniques you used to compare the columns, and the results you obtained. Some common documentation practices include:
- Creating a data dictionary: Define the meaning and format of each column in your data.
- Writing a comparison plan: Outline the steps you will take to compare the columns, including the data preparation tasks, the comparison techniques, and the reporting requirements.
- Commenting your formulas: Add comments to your Excel formulas to explain what they do and why you used them.
- Creating a comparison report: Summarize the results of your column comparison in a clear and concise report.
- Saving your Excel file: Save your Excel file with a descriptive name and version number.
11. Real-World Examples of Column Comparison
11.1 Comparing Sales Data
In sales analysis, comparing multiple columns of data is crucial for identifying trends, tracking performance, and making informed decisions. For instance, a sales manager might want to compare sales data from different regions, product lines, or time periods to identify top-performing areas and areas that need improvement. By comparing columns of sales figures, revenue, and profit margins, they can gain insights into which products are selling well, which regions are generating the most revenue, and which marketing campaigns are most effective. This information can then be used to optimize sales strategies, allocate resources effectively, and drive overall business growth.
11.2 Comparing Inventory Lists
Inventory management relies heavily on accurate and up-to-date data. Comparing multiple columns in inventory lists can help identify discrepancies, track stock levels, and prevent shortages or overstocking. For example, a warehouse manager might want to compare an inventory list with a list of recent sales orders to determine which items are running low and need to be reordered. By comparing columns of product names, quantities, and order dates, they can ensure that the right products are in stock at the right time, minimizing stockouts and maximizing customer satisfaction.
11.3 Comparing Customer Databases
Customer relationship management (CRM) involves managing and analyzing customer data to improve customer service, increase sales, and build stronger customer relationships. Comparing multiple columns in customer databases can help identify duplicate records, update contact information, and segment customers based on their demographics, purchase history, or other criteria. For example, a marketing manager might want to compare two customer databases to identify duplicate records and merge them into a single, unified database. By comparing columns of customer names, addresses, and email addresses, they can eliminate duplicate entries and ensure that their customer data is accurate and complete.
12. Common Issues and Troubleshooting
12.1 Formula Errors
When working with formulas for column comparison in Excel, it’s common to encounter errors such as #VALUE!, #NAME?, or #REF!. These errors can be caused by a variety of factors, such as incorrect syntax, invalid cell references, or incompatible data types. To troubleshoot formula errors, start by carefully reviewing the formula and ensuring that all the cell references are correct and that the data types are compatible. Use Excel’s formula auditing tools, such as “Trace Precedents” and “Trace Dependents,” to identify the source of the error. If you’re still having trouble, try breaking the formula down into smaller, simpler parts to isolate the problem.
12.2 Performance Issues
When working with large datasets, column comparison can be computationally intensive and may cause Excel to slow down or freeze. To improve performance, try the following tips:
- Use array formulas sparingly: Array formulas can be powerful, but they can also be slow, especially when used on large datasets. Try to avoid using array formulas if possible, or use them only on a small subset of your data.
- Turn off automatic calculations: Excel’s automatic calculation feature can slow down performance when working with large datasets. Turn off automatic calculations by going to “Formulas” > “Calculation Options” and selecting “Manual.”
- Use helper columns: Helper columns can be used to perform intermediate calculations, reducing the complexity of your formulas and improving performance.
- Use Power Query: Power Query is designed to handle large datasets efficiently. Use Power Query to import, transform, and compare your data, and then load the results into your spreadsheet.
12.3 Data Type Mismatches
Data type mismatches can cause unexpected results when comparing columns in Excel. For example, if you try to compare a text column with a number column, Excel may not be able to perform the comparison correctly. To avoid data type mismatches, ensure that the data types in the columns you’re comparing are compatible. Use Excel’s TYPE function to determine the data type of a cell. If necessary, use functions like VALUE or TEXT to convert the data types to a compatible format.
13. Optimizing Your Excel Skills for Data Comparison
13.1 Keyboard Shortcuts
Mastering keyboard shortcuts can significantly speed up your column comparison tasks in Excel. Some useful shortcuts include:
Ctrl+C: CopyCtrl+V: PasteCtrl+X: CutCtrl+Z: UndoCtrl+Y: RedoCtrl+A: Select AllCtrl+F: FindCtrl+H: ReplaceCtrl+Shift+Enter: Enter Array FormulaAlt+H, H: Open Conditional Formatting Menu
13.2 Customizing the Excel Interface
Customizing the Excel interface can help you streamline your column comparison workflow and access the tools you use most often. You can customize the ribbon by adding or removing tabs, groups, and commands. You can also customize the Quick Access Toolbar by adding frequently used commands. To customize the Excel interface, go to “File” > “Options” > “Customize Ribbon” or “Quick Access Toolbar.”
13.3 Using Excel Templates
Excel templates can save you time and effort by providing pre-built spreadsheets with formulas, formatting, and layouts that are optimized for specific tasks. There are many Excel templates available online for various column comparison scenarios, such as comparing sales data, inventory lists, or customer databases. To use an Excel template, go to “File” > “New” and search for a template that suits your needs.
14. The Future of Data Comparison in Excel
14.1 Integration with AI and Machine Learning
The future of data comparison in Excel is likely to be shaped by the integration of artificial intelligence (AI) and machine learning (ML) technologies. AI and ML can be used to automate many of the tasks involved in column comparison, such as data cleaning, data transformation, and anomaly detection. For example, AI could be used to automatically identify and correct errors in your data, or to predict which columns are most likely to contain relevant information.
14.2 Cloud-Based Solutions
Cloud-based solutions are also likely to play a growing role in data comparison in Excel. Cloud-based Excel alternatives, such as Google Sheets and Microsoft Office Online, offer several advantages over traditional desktop applications, including:
- Collaboration: Cloud-based solutions make it easier to collaborate with others on data comparison tasks.
- Accessibility: Cloud-based solutions can be accessed from anywhere with an internet connection.
- Scalability: Cloud-based solutions can easily scale to handle large datasets.
14.3 Enhanced Visualization Tools
Enhanced visualization tools will also be important for data comparison in Excel. Visualizations can help you to quickly identify patterns, trends, and anomalies in your data. Excel already provides a variety of visualization tools, such as charts, graphs, and conditional formatting. However, future versions of Excel are likely to include even more advanced visualization tools, such as interactive dashboards and 3D charts.
15. Conclusion: Leveraging Excel for Effective Data Analysis
In conclusion, mastering the art of comparing multiple columns in Excel is an invaluable skill for anyone working with data. Whether you’re analyzing sales figures, managing inventory, or comparing customer databases, the techniques and tools discussed in this guide will empower you to extract meaningful insights and make informed decisions. From basic formulas like IF and COUNTIF to advanced techniques like array formulas, Power Query, and VBA, Excel offers a wide range of options for comparing data efficiently and accurately. By following the best practices outlined in this guide, you can ensure that your data is clean, consistent, and reliable, and that your comparison results are meaningful and actionable. And remember, for more expert guidance and resources on data comparison and analysis, visit COMPARE.EDU.VN.
Need to compare various options to make the best decision? Visit COMPARE.EDU.VN for comprehensive and objective comparisons that simplify your choices. Our detailed analyses provide the insights you need to confidently select the best products, services, or ideas. Start making smarter decisions today. For further assistance, contact us at 333 Comparison Plaza, Choice City, CA 90210, United States, Whatsapp: +1 (626) 555-9090. Visit our website at compare.edu.vn.
Frequently Asked Questions (FAQs)
-
How can I compare two columns for exact matches in Excel?
- Use the formula
=IF(A1=B1, "Match", "No Match")to compare the values in cell A1 and B1. Drag the formula down to apply it to the entire column.
- Use the formula
-
How do I compare columns while ignoring case sensitivity?
- Use the
EXACTfunction for case-sensitive comparisons:=IF(EXACT(A1, B1), "Match", "No Match").
- Use the
-
How can I highlight matching values in two columns using conditional formatting?
- Select the range, go to “Conditional Formatting” > “New Rule” > “Use a formula,” and enter
=A1=B1. Choose a formatting style.
- Select the range, go to “Conditional Formatting” > “New Rule” > “Use a formula,” and enter
-
What is the best way to compare columns with different lengths?
- Use
ISERRORwithMATCH:=IF(ISERROR(MATCH(A1, B:B, 0)), "Not Found", "Found")to compare the shorter column against the longer column.
- Use
5