How To Compare Ir Spectra? Comparing infrared (IR) spectra is crucial for product quality and safety, especially in industries like pharmaceuticals and cosmetics. COMPARE.EDU.VN offers detailed comparisons and insights to help you accurately analyze and interpret IR spectra, ensuring you make informed decisions. This article provides a comprehensive guide on how to effectively compare IR spectra, covering essential parameters and techniques for accurate analysis, including spectral interpretation, identity testing, and understanding alkane chain lengths.
Table of Contents
- Understanding IR Spectroscopy
- The Importance of Spectral Comparisons
- Variables to Control When Comparing Spectra
- Determining Alkane Chain Length from Infrared Spectra
- Advanced Techniques in IR Spectral Comparison
- Applications of IR Spectral Comparison
- Common Pitfalls in IR Spectral Comparison
- Case Studies: Successful IR Spectral Comparisons
- The Role of COMPARE.EDU.VN in Spectral Analysis
- Frequently Asked Questions (FAQs)
- Conclusion
1. Understanding IR Spectroscopy
Infrared (IR) spectroscopy is an analytical technique used to identify and study chemicals. It relies on the principle that molecules absorb specific frequencies of IR radiation, which correspond to the vibrations of bonds within the molecule. By analyzing the absorption patterns, one can determine the chemical composition and structure of a sample. According to “Fundamentals of Fourier Transform Infrared Spectroscopy” by Brian C. Smith, each molecule has a unique IR spectrum, making it a powerful tool for identification and comparison.
IR spectroscopy measures how much infrared radiation a sample absorbs at different wavelengths or frequencies. When a molecule absorbs IR radiation, its bonds vibrate by stretching or bending. These vibrations are specific to the types of bonds and atoms in the molecule. The resulting spectrum, a plot of absorbance versus frequency, shows peaks at the frequencies where absorption occurs. The position, intensity, and shape of these peaks provide information about the molecule’s structure and composition. Understanding the basics of IR spectroscopy is essential for anyone looking to compare IR spectra effectively. The ability to interpret these spectra can lead to precise material identification and quality control.
2. The Importance of Spectral Comparisons
Spectral comparisons are vital for ensuring product quality and safety. In industries such as pharmaceuticals, dietary supplements, and cosmetics, it’s crucial to verify the identity and purity of raw materials and final products. According to a study by the University of California, spectral comparison, also known as identity testing, involves comparing the IR spectrum of an unknown sample to that of a known standard. This process confirms whether the sample matches the reference, ensuring that the correct material is being used.
Identity testing is not just about confirming the presence of a specific compound; it also helps detect contaminants or deviations from the expected composition. This is particularly important in the pharmaceutical industry, where even small variations can impact the efficacy and safety of a drug. For example, if the IR spectrum of an incoming raw material doesn’t match the reference spectrum, it could indicate that the material is not what it’s supposed to be or that it has been contaminated. Proper spectral comparison ensures that products meet required standards, preventing potentially harmful consequences. This type of rigorous testing helps manufacturers maintain the integrity of their products and protect consumers.
3. Variables to Control When Comparing Spectra
When performing spectral comparisons, controlling experimental variables is essential to ensure that any observed differences are due to the samples themselves rather than variations in the measurement process. Key variables to consider include scanning parameters, sample preparation technique, the instrument used, and the operator. According to research from the University of Analytical Chemistry, neglecting these variables can lead to inaccurate comparisons and incorrect conclusions.
3.1 Scanning Parameters
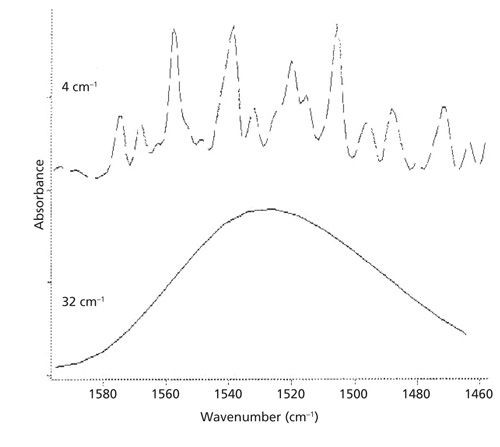
Scanning parameters such as the number of scans, instrumental resolution, and apodization function significantly affect the appearance of a spectrum. The instrumental resolution, in particular, has a pronounced effect. For instance, a high resolution will show well-resolved peaks, while a low resolution may produce broad, overlapping bands. Controlling these parameters ensures that the spectra being compared are measured under identical conditions.
Consider the example of water vapor: When measured at a high instrumental resolution (e.g., 4 cm-1), the IR spectrum shows a series of well-resolved peaks. However, when the same sample is measured at a low resolution (e.g., 32 cm-1), the spectrum appears as a broad blob with no resolved peaks. If you were unaware of the change in resolution, you might incorrectly assume that you are looking at different materials. Therefore, maintaining consistent scanning parameters is critical for accurate spectral comparisons.
3.2 Sample Preparation Technique
Different sample preparation techniques can also cause spectra to look different. For example, using Attenuated Total Reflection (ATR) versus non-ATR methods can result in variations in peak intensities. In ATR, the depth of penetration varies with wavenumber, leading to reduced peak intensities at higher wavenumbers. If spectra are acquired using different techniques, they cannot be directly compared without accounting for these differences.
For example, the spectrum of sucrose measured using ATR will show different peak sizes compared to the spectrum of sucrose measured using a non-ATR method. In ATR, peaks around 1000 and 3200 cm-1 will have different intensities due to the wavenumber-dependent depth of penetration. However, when measured using a non-ATR technique, these peaks will be about the same size. Always use the same sample preparation technique for both the sample and the reference to ensure comparability.
3.3 The Instrument Used
Ideally, the same instrument should be used to measure both the sample and reference spectra. Each instrument adds unique noise and artifacts to the spectra, even with efforts to eliminate this problem. While differences should be minimal if the instruments are functioning correctly, using the same instrument minimizes variability.
However, if a reference spectrum is obtained from a spectral library or the literature, some subtle differences may arise due to the use of different instruments. Understanding this potential source of variability is important when interpreting the results of spectral comparisons. Always document the instrument used for each measurement to account for potential discrepancies.
3.4 The Operator
The operator can also introduce variability, especially in manually intensive sample preparation techniques like KBr pellet preparation. Differences in how operators prepare samples can lead to variability in the measured spectra. To minimize this, ensure that all operators are properly trained and follow a clearly written standard operating procedure (SOP).
In a perfect world, the same person would prepare and measure the spectra of both the sample and reference materials. However, if multiple operators are involved, consistent training and adherence to SOPs are essential to ensure reliable and reproducible results. This control of operator variability helps maintain the integrity of the spectral comparison process.
4. Determining Alkane Chain Length from Infrared Spectra
IR spectroscopy can be used to estimate the chain length of straight-chain alkanes, although the accuracy depends on several factors. The presence or absence of the methylene CH2 rocking peak at 720 ±10 cm-1 indicates whether there are alkyl chains with four or more methylenes in a row. Additionally, the ratio of CH2/CH3 peak intensities correlates with the methylene to methyl ratio in the sample.
By comparing the intensities of the methyl and methylene peaks, one can infer the relative chain length. For instance, in hexane, where the CH2/CH3 ratio is 2, the methyl and methylene asymmetric stretching peaks are about the same size. In contrast, for octane, where the CH2/CH3 ratio is 3, the methylene asymmetric stretching peak is larger than the methyl peak. For longer alkanes, such as petroleum jelly, where the CH2/CH3 ratio is at least 16, the methylene peaks dominate, and the methyl peak appears as a small shoulder.
While these observations provide a general idea of alkyl chain length, quantitative methods exist that involve measuring the intensities of the CH2 and CH3 asymmetric stretches in known alkanes and plotting the peak intensity ratio versus the CH2/CH3 ratio. This calibration can then be used to determine the CH2/CH3 ratio for an unknown sample. However, in the absence of such a calibration, the relative heights of the methyl and methylene peaks can still provide a useful estimate of overall alkyl chain length.
5. Advanced Techniques in IR Spectral Comparison
Beyond basic visual comparison, several advanced techniques enhance the accuracy and reliability of IR spectral analysis. These include spectral subtraction, derivative spectroscopy, and chemometric methods. Spectral subtraction involves removing the spectrum of a known component from a mixture to reveal the spectrum of the remaining components. Derivative spectroscopy enhances subtle spectral features by calculating the first or second derivative of the spectrum, making it easier to identify shoulders or small peaks. Chemometric methods use statistical techniques to analyze complex spectral data, enabling quantitative analysis and classification of samples.
According to a study published in the “Journal of Applied Spectroscopy,” spectral subtraction can effectively identify trace contaminants in a sample by removing the spectrum of the main component. Derivative spectroscopy is particularly useful for resolving overlapping peaks, while chemometric methods can be used to develop predictive models for quality control. These advanced techniques, when applied correctly, provide a more comprehensive and accurate analysis of IR spectra.
6. Applications of IR Spectral Comparison
IR spectral comparison has a wide range of applications across various industries. In the pharmaceutical industry, it is used for raw material identification, quality control of drug products, and detection of counterfeit drugs. In the food industry, it is used to verify the authenticity of ingredients, detect adulteration, and monitor food quality. In the environmental field, it is used to identify pollutants in air and water samples. In forensic science, it is used for the identification of unknown substances at crime scenes.
For example, a study by the Food Safety and Standards Authority of India (FSSAI) demonstrated the use of IR spectroscopy to detect adulteration in edible oils. By comparing the IR spectra of different oil samples, researchers were able to identify the presence of adulterants with high accuracy. Similarly, in the pharmaceutical industry, IR spectroscopy is routinely used to ensure that each batch of tablets contains the correct active ingredient and that no counterfeit drugs are present in the market.
7. Common Pitfalls in IR Spectral Comparison
Despite its power, IR spectral comparison is prone to several pitfalls that can lead to incorrect conclusions. One common pitfall is the neglect of proper baseline correction, which can distort peak intensities and positions. Another is the failure to account for variations in sample thickness, which can affect the overall absorbance. Over-interpretation of minor peaks or noise can also lead to misidentification of components.
According to expert Brian C. Smith, careful attention to experimental details and proper data processing is essential to avoid these pitfalls. Baseline correction should be performed to remove any background absorbance. Sample thickness should be controlled to ensure consistent results. Minor peaks should be interpreted cautiously, and only after considering other spectral features. By being aware of these potential pitfalls, analysts can ensure the accuracy and reliability of their spectral comparisons.
8. Case Studies: Successful IR Spectral Comparisons
Several case studies highlight the successful application of IR spectral comparison in solving real-world problems. One case study involves the identification of a contaminant in a pharmaceutical product. By comparing the IR spectrum of the contaminated product with that of a pure reference material, the contaminant was identified as a plasticizer leached from the packaging material.
Another case study involves the authentication of a rare herbal extract. By comparing the IR spectrum of the extract with that of a known authentic sample, researchers were able to verify its identity and purity. A third case study involves the monitoring of the degradation of a polymer film. By comparing the IR spectra of the film at different time points, researchers were able to track the changes in its chemical composition and determine the rate of degradation. These case studies demonstrate the versatility and power of IR spectral comparison in addressing a wide range of analytical challenges.
9. The Role of COMPARE.EDU.VN in Spectral Analysis
COMPARE.EDU.VN is designed to assist users in making informed decisions by providing comprehensive comparisons of various products, services, and ideas. In the context of spectral analysis, COMPARE.EDU.VN can offer resources and tools to compare different spectral analysis software, databases, and instruments. This helps users choose the best tools for their specific needs and ensures that they have access to accurate and reliable information for spectral interpretation.
By offering detailed comparisons and reviews, COMPARE.EDU.VN simplifies the process of selecting spectral analysis resources. Whether you are a student, a consumer, or a professional, COMPARE.EDU.VN provides the information you need to make informed decisions about spectral analysis tools and techniques. Our platform helps you understand the strengths and weaknesses of different options, ensuring that you choose the best approach for your analytical challenges.
For more detailed comparisons and resources, visit COMPARE.EDU.VN. Our comprehensive guides and reviews can help you navigate the complexities of spectral analysis and make the right choices for your specific needs.
Contact Information:
- Address: 333 Comparison Plaza, Choice City, CA 90210, United States
- WhatsApp: +1 (626) 555-9090
- Website: COMPARE.EDU.VN
10. Frequently Asked Questions (FAQs)
Q1: What is IR spectroscopy used for?
IR spectroscopy is used to identify and study chemicals based on their unique absorption patterns of infrared radiation, helping determine their composition and structure. It is particularly useful in industries like pharmaceuticals, food, and environmental science for quality control and substance identification.
Q2: How does instrumental resolution affect spectral appearance?
Instrumental resolution greatly impacts spectral clarity. High resolution shows well-resolved peaks, while low resolution results in broad, overlapping bands, potentially leading to misinterpretations of the spectrum.
Q3: Why is sample preparation important in IR spectroscopy?
Different sample preparation techniques, such as ATR versus non-ATR methods, can affect peak intensities due to variations in the depth of penetration. Consistent sample preparation ensures reliable and comparable results.
Q4: Can IR spectra determine alkane chain length?
Yes, but with caveats. The presence of a methylene CH2 rocking peak and the ratio of CH2/CH3 peak intensities can provide an estimate of alkane chain length. Quantitative methods involving calibration curves improve accuracy.
Q5: What are some advanced techniques for IR spectral comparison?
Advanced techniques include spectral subtraction, derivative spectroscopy, and chemometric methods, which enhance the accuracy and reliability of spectral analysis by removing known components, resolving overlapping peaks, and enabling quantitative analysis.
Q6: What are common pitfalls in IR spectral comparison?
Common pitfalls include neglecting proper baseline correction, failing to account for variations in sample thickness, and over-interpreting minor peaks or noise, all of which can lead to incorrect conclusions.
Q7: How can COMPARE.EDU.VN help with spectral analysis?
COMPARE.EDU.VN offers resources and tools to compare different spectral analysis software, databases, and instruments, helping users choose the best tools for their specific needs and ensuring access to reliable information for spectral interpretation.
Q8: What industries commonly use IR spectral comparison?
Industries that commonly use IR spectral comparison include pharmaceuticals, food, environmental science, and forensic science, for applications ranging from quality control to substance identification.
Q9: How do I ensure my IR spectral comparisons are accurate?
Ensure accuracy by controlling scanning parameters, maintaining consistent sample preparation techniques, using the same instrument when possible, and training operators to follow standard operating procedures.
Q10: Where can I find reliable reference spectra for comparison?
Reliable reference spectra can be found in spectral libraries, scientific literature, and databases provided by reputable manufacturers of spectral analysis equipment. Always verify the source and experimental conditions of reference spectra.
11. Conclusion
Comparing IR spectra accurately is crucial for ensuring product quality, safety, and correct chemical identification. By controlling variables such as scanning parameters, sample preparation, the instrument used, and the operator, one can minimize errors and ensure reliable results. Advanced techniques like spectral subtraction and chemometric methods can further enhance the accuracy of spectral analysis. With its comprehensive resources and tools, COMPARE.EDU.VN can assist users in making informed decisions about spectral analysis, providing detailed comparisons of various software, databases, and instruments. Whether you are in pharmaceuticals, food science, or environmental monitoring, mastering the art of IR spectral comparison will significantly improve your analytical capabilities.
Remember, accurate spectral comparison leads to informed decisions. Visit compare.edu.vn today to explore our detailed comparisons and find the perfect solutions for your needs.