Comparing information in two Excel spreadsheets can be challenging, but it’s crucial for data validation, error detection, and informed decision-making. At COMPARE.EDU.VN, we provide insights into how to efficiently compare data, identify discrepancies, and ensure data integrity, while leveraging Excel’s built-in features and external tools for accurate comparisons. Unlock the power of data comparison, discover spreadsheet differences, and ensure data accuracy.
1. Understanding the Need for Excel Spreadsheet Comparison
The need to compare information in two Excel spreadsheets arises in numerous situations across various professions and industries. Data comparison can be a complex task.
1.1. Scenarios Requiring Spreadsheet Comparison
- Financial Auditing: Auditors often need to compare financial statements from different periods or sources to identify discrepancies, fraud, or errors.
- Data Migration: When migrating data from one system to another, comparing the source and destination spreadsheets ensures data integrity.
- Version Control: In collaborative environments, comparing different versions of a spreadsheet helps track changes made by various users.
- Sales Analysis: Comparing sales data from different regions or time periods helps identify trends, patterns, and areas for improvement.
- Inventory Management: Comparing inventory records with physical counts ensures accuracy and prevents stockouts or overstocking.
- Scientific Research: Researchers compare data sets from different experiments or sources to validate findings and draw conclusions.
- Project Management: Comparing project plans with actual progress helps identify delays, budget overruns, and other issues.
- Compliance Reporting: Comparing data against regulatory requirements ensures compliance and avoids penalties.
1.2. Challenges in Comparing Spreadsheets
- Large Datasets: Comparing large spreadsheets with thousands of rows and columns can be time-consuming and error-prone.
- Complex Formulas: Identifying differences in complex formulas and calculations requires specialized tools and expertise.
- Formatting Variations: Differences in formatting, such as fonts, colors, and cell styles, can obscure meaningful data discrepancies.
- Hidden Rows and Columns: Hidden rows and columns can contain important data that is easily overlooked during manual comparison.
- Data Types: Comparing data with different data types, such as numbers, text, and dates, requires careful consideration and conversion.
- Inconsistent Data Entry: Variations in data entry, such as spelling errors, abbreviations, and different units of measure, can lead to false positives or negatives.
- Lack of Automation: Manual comparison is tedious and inefficient, especially for repetitive tasks.
- Password Protection: Password-protected spreadsheets require additional steps to access and compare their contents.
1.3. Benefits of Effective Spreadsheet Comparison
- Improved Data Quality: Identifying and correcting errors and inconsistencies improves the overall quality of data.
- Reduced Risk: Detecting fraud, errors, and compliance violations reduces financial and reputational risks.
- Better Decision-Making: Accurate and reliable data leads to more informed and effective decision-making.
- Increased Efficiency: Automated comparison tools save time and effort compared to manual methods.
- Enhanced Collaboration: Clear and concise comparison reports facilitate collaboration and communication among team members.
- Streamlined Processes: Identifying and eliminating bottlenecks in data processing workflows improves overall efficiency.
- Greater Transparency: Documenting and tracking changes to spreadsheets provides greater transparency and accountability.
- Competitive Advantage: Organizations that effectively manage and analyze their data gain a competitive advantage.
2. Preparing Excel Spreadsheets for Comparison
Before diving into the comparison process, it’s essential to prepare your Excel spreadsheets to ensure accurate and efficient results. Preparation is key to success.
2.1. Standardizing Data Formats
- Consistent Date Formats: Ensure that all dates are in the same format (e.g., MM/DD/YYYY or DD/MM/YYYY) to avoid misinterpretation.
- Uniform Number Formats: Use the same number format (e.g., decimal places, currency symbols, thousands separators) throughout the spreadsheet.
- Matching Text Case: Convert all text to the same case (e.g., uppercase or lowercase) to avoid case-sensitive differences.
- Consistent Units of Measure: Use the same units of measure (e.g., kilograms or pounds, meters or feet) for all data entries.
- Standardized Abbreviations: Replace abbreviations with full words or use a consistent set of abbreviations.
2.2. Cleaning Data for Accuracy
- Removing Duplicate Rows: Identify and remove duplicate rows to avoid skewing the comparison results.
- Correcting Spelling Errors: Use Excel’s spell checker to correct spelling errors and typos.
- Eliminating Extra Spaces: Remove leading, trailing, and excessive spaces from text entries.
- Handling Missing Values: Decide how to handle missing values (e.g., replace with a default value, ignore, or flag for review).
- Resolving Inconsistencies: Investigate and resolve any inconsistencies in data entry or formatting.
2.3. Structuring Data for Comparison
- Matching Column Headers: Ensure that column headers are identical in both spreadsheets to facilitate accurate comparison.
- Consistent Column Order: Arrange columns in the same order in both spreadsheets to simplify visual comparison.
- Using Unique Identifiers: Include a unique identifier column (e.g., product ID, customer ID) to ensure that rows are matched correctly.
- Avoiding Merged Cells: Avoid using merged cells, as they can complicate the comparison process.
- Splitting Complex Columns: Split complex columns containing multiple pieces of information into separate columns.
2.4. Removing Irrelevant Data
- Filtering Unnecessary Rows: Filter out rows that are not relevant to the comparison (e.g., summary rows, comments).
- Hiding Unnecessary Columns: Hide columns that are not needed for the comparison to reduce clutter.
- Deleting Test Data: Remove any test data or sample entries from the spreadsheets.
- Excluding Confidential Information: Protect confidential information by removing or redacting it before sharing the spreadsheets.
- Simplifying Formulas: Replace complex formulas with their calculated values if the formulas themselves are not the focus of the comparison.
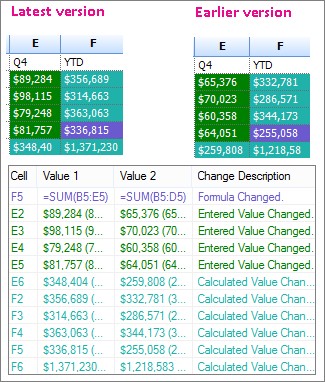 Comparison results of two versions of a workbook
3. Utilizing Excel’s Built-in Comparison Features
Excel offers several built-in features that can be used to compare information in two spreadsheets. These features provide a quick and easy way to identify differences and inconsistencies. Excel is your friend.
3.1. Conditional Formatting for Highlighting Differences
- Highlighting Duplicate Values: Use conditional formatting to highlight duplicate values in one or both spreadsheets.
- Highlighting Unique Values: Use conditional formatting to highlight unique values in one or both spreadsheets.
- Highlighting Cell Differences: Use a formula-based conditional formatting rule to highlight cells that are different between the two spreadsheets.
- Highlighting Rows with Differences: Use a formula-based conditional formatting rule to highlight entire rows that contain differences.
- Using Color Scales: Use color scales to visually represent the magnitude of differences between cells.
3.2. Formula-Based Comparison
- Using the EXACT Function: Use the
EXACTfunction to compare two text strings and returnTRUEif they are identical,FALSEotherwise. - Using the IF Function: Use the
IFfunction to compare two values and return a specified value if they are equal, another value if they are different. - Using the COUNTIF Function: Use the
COUNTIFfunction to count the number of times a value appears in a range, which can be used to identify differences in data frequency. - Using the SUMIF Function: Use the
SUMIFfunction to sum values in a range based on a condition, which can be used to compare totals between the two spreadsheets. - Using Array Formulas: Use array formulas to compare entire ranges of cells at once, which can be more efficient than comparing individual cells.
3.3. Side-by-Side View
- Opening Both Spreadsheets: Open both spreadsheets that you want to compare in Excel.
- Arranging Windows Side-by-Side: Go to the “View” tab and click “View Side by Side” to arrange the two spreadsheet windows next to each other.
- Synchronous Scrolling: Enable synchronous scrolling to scroll both spreadsheets simultaneously, making it easier to compare corresponding rows and columns.
- Manual Comparison: Manually compare the data in the two spreadsheets, looking for differences and inconsistencies.
- Using Zoom: Adjust the zoom level to make the data easier to read and compare.
3.4. The “Go To Special” Feature
- Selecting a Range: Select the range of cells that you want to compare in both spreadsheets.
- Opening the “Go To Special” Dialog Box: Press
F5or go to the “Home” tab, click “Find & Select,” and then click “Go To Special.” - Choosing “Row Differences” or “Column Differences”: In the “Go To Special” dialog box, select “Row Differences” or “Column Differences” to highlight cells that are different from the corresponding cells in the active row or column.
- Reviewing the Results: Review the highlighted cells and investigate the differences.
- Applying Conditional Formatting: Apply conditional formatting to further highlight and visualize the differences.
4. Leveraging Advanced Comparison Tools and Techniques
For more complex comparisons, consider using advanced tools and techniques that go beyond Excel’s built-in features. The right tool can make all the difference.
4.1. Microsoft Spreadsheet Compare
- Availability: Microsoft Spreadsheet Compare is available with Office Professional Plus 2013, Office Professional Plus 2016, Office Professional Plus 2019, or Microsoft 365 Apps for enterprise.
- Opening Spreadsheet Compare: On the Start screen, click Spreadsheet Compare. If you do not see a Spreadsheet Compare option, begin typing the words Spreadsheet Compare, and then select its option.
- Selecting Files: Click Home > Compare Files. The Compare Files dialog box appears. Click the blue folder icon next to the Compare box to browse to the location of the earlier version of your workbook. Click the green folder icon next to the To box to browse to the location of the workbook that you want to compare to the earlier version, and then click OK.
- Choosing Comparison Options: In the left pane, choose the options you want to see in the results of the workbook comparison by checking or unchecking the options, such as Formulas, Macros, or Cell Format. Or, just Select All.
- Running the Comparison: Click OK to run the comparison.
- Understanding the Results: The results of the comparison appear in a two-pane grid. The workbook on the left corresponds to the “Compare” (typically older) file you chose and the workbook on the right corresponds to the “To” (typically newer) file. Details appear in a pane below the two grids. Changes are highlighted by color, depending on the kind of change.
4.2. Using Excel Add-ins
- ASAP Utilities: ASAP Utilities is a popular Excel add-in that provides a wide range of tools for data analysis, formatting, and manipulation, including a “Compare two lists” feature.
- Ablebits Data Comparer: Ablebits Data Comparer is a powerful add-in that allows you to compare two Excel worksheets or workbooks and identify differences based on various criteria, such as cell values, formulas, and formatting.
- Synkronizer Excel Compare: Synkronizer Excel Compare is an add-in that helps you compare Excel files and highlight differences in cell values, formulas, and comments.
- XL Comparator: XL Comparator is an Excel add-in designed to compare and merge Excel files, highlighting differences and allowing you to synchronize data between files.
- DiffEngineX: DiffEngineX is a professional Excel compare tool that provides detailed reports on differences between Excel files, including cell values, formulas, VBA code, and chart data.
4.3. Database Comparison Techniques
- Importing Excel Data into a Database: Import the data from both Excel spreadsheets into a database management system (DBMS) such as Microsoft Access, SQL Server, or MySQL.
- Using SQL Queries to Compare Data: Use SQL queries to compare the data in the two tables, identifying differences and inconsistencies.
- Joining Tables: Use SQL JOIN operations to combine data from the two tables based on a common key, such as a unique identifier.
- Using the EXCEPT Operator: Use the SQL EXCEPT operator to find rows that exist in one table but not in the other.
- Using the INTERSECT Operator: Use the SQL INTERSECT operator to find rows that exist in both tables.
4.4. Programming with VBA (Visual Basic for Applications)
- Writing Custom Comparison Functions: Write custom VBA functions to compare data in the two spreadsheets based on specific criteria.
- Looping Through Cells: Use VBA loops to iterate through the cells in the two spreadsheets and compare their values.
- Using Conditional Statements: Use VBA conditional statements (e.g.,
If...Then...Else) to handle different comparison scenarios. - Highlighting Differences: Use VBA to highlight differences in the spreadsheets by changing cell colors, fonts, or borders.
- Creating Comparison Reports: Use VBA to generate comparison reports that summarize the differences found between the two spreadsheets.
5. Interpreting and Presenting Comparison Results
Once you have compared the spreadsheets, it’s essential to interpret the results and present them in a clear and concise manner. Clarity is key.
5.1. Creating Summary Reports
- Identifying Key Differences: Summarize the key differences between the two spreadsheets in a table or list.
- Quantifying the Impact of Differences: Quantify the impact of the differences on key metrics, such as totals, averages, or percentages.
- Categorizing Differences: Categorize the differences based on their type (e.g., data entry errors, formula errors, formatting inconsistencies).
- Prioritizing Differences: Prioritize the differences based on their severity or importance.
- Providing Recommendations: Provide recommendations for resolving the differences and preventing them from recurring in the future.
5.2. Visualizing Differences
- Using Charts and Graphs: Use charts and graphs to visualize the differences between the two spreadsheets, such as bar charts, line charts, or scatter plots.
- Creating Heatmaps: Create heatmaps to visually represent the magnitude of differences across the spreadsheets.
- Using Color-Coding: Use color-coding to highlight different types of differences in the spreadsheets.
- Adding Annotations: Add annotations to the spreadsheets to explain the differences and provide context.
- Using Sparklines: Use sparklines to show trends and patterns in the data, which can help highlight differences.
5.3. Documenting the Comparison Process
- Recording the Steps Taken: Document the steps taken to compare the spreadsheets, including the tools and techniques used.
- Noting Any Assumptions Made: Note any assumptions made during the comparison process.
- Listing Any Limitations: List any limitations of the comparison process.
- Including Screenshots: Include screenshots of the spreadsheets and the comparison results.
- Storing the Documentation with the Spreadsheets: Store the documentation with the spreadsheets so that it is easily accessible.
5.4. Communicating the Results
- Tailoring the Communication to the Audience: Tailor the communication to the audience, providing the level of detail and explanation that they need.
- Using Clear and Concise Language: Use clear and concise language to explain the differences.
- Avoiding Jargon: Avoid using jargon or technical terms that the audience may not understand.
- Providing Context: Provide context for the differences, explaining why they are important.
- Being Objective: Be objective in your communication, presenting the facts without bias.
6. Best Practices for Spreadsheet Comparison
To ensure accurate and efficient spreadsheet comparison, follow these best practices. Practice makes perfect.
6.1. Establish Clear Comparison Objectives
- Define the Purpose of the Comparison: Clearly define the purpose of the comparison, such as identifying errors, tracking changes, or validating data.
- Determine the Scope of the Comparison: Determine the scope of the comparison, specifying which data elements and time periods to include.
- Identify Key Metrics: Identify the key metrics that will be used to measure the differences between the spreadsheets.
- Set Expectations: Set expectations for the level of accuracy and detail required in the comparison.
- Document the Objectives: Document the objectives of the comparison so that everyone is on the same page.
6.2. Use Version Control
- Implement a Version Control System: Implement a version control system to track changes to the spreadsheets over time.
- Use Descriptive File Names: Use descriptive file names that include the date and time of the version.
- Store Versions in a Central Location: Store versions of the spreadsheets in a central location that is accessible to all team members.
- Use Comments to Explain Changes: Use comments to explain the changes made in each version.
- Regularly Back Up Versions: Regularly back up versions of the spreadsheets to prevent data loss.
6.3. Automate the Comparison Process
- Use Automated Tools: Use automated tools, such as Microsoft Spreadsheet Compare or Excel add-ins, to automate the comparison process.
- Create Macros: Create macros to automate repetitive tasks, such as formatting data or generating reports.
- Schedule Regular Comparisons: Schedule regular comparisons to monitor changes and identify errors early.
- Integrate with Other Systems: Integrate the comparison process with other systems, such as databases or data warehouses.
- Monitor Performance: Monitor the performance of the automated comparison process and make adjustments as needed.
6.4. Validate the Comparison Results
- Manually Review a Sample of Results: Manually review a sample of the comparison results to ensure accuracy.
- Compare Results with Other Sources: Compare the comparison results with other sources of data, such as databases or reports.
- Use a Second Person to Review the Results: Use a second person to review the comparison results and identify any errors or inconsistencies.
- Document the Validation Process: Document the validation process, including the steps taken and the results obtained.
- Address Any Discrepancies: Address any discrepancies found during the validation process and make corrections as needed.
6.5. Train Users on Spreadsheet Comparison Techniques
- Provide Training on Excel’s Built-in Features: Provide training on Excel’s built-in features for comparing spreadsheets, such as conditional formatting and formula-based comparison.
- Train Users on Advanced Comparison Tools: Train users on how to use advanced comparison tools, such as Microsoft Spreadsheet Compare and Excel add-ins.
- Teach Users Best Practices: Teach users best practices for spreadsheet comparison, such as standardizing data formats and cleaning data.
- Provide Ongoing Support: Provide ongoing support to users as they use spreadsheet comparison techniques in their work.
- Encourage Knowledge Sharing: Encourage users to share their knowledge and experience with spreadsheet comparison with others.
COMPARE.EDU.VN is your resource for comparing information effectively, offering tools and techniques to make data comparison seamless.
7. Common Mistakes to Avoid During Spreadsheet Comparison
Even with the best tools and techniques, it’s easy to make mistakes during spreadsheet comparison. Avoiding these common pitfalls can improve accuracy and efficiency. Awareness is the first step.
7.1. Ignoring Data Formatting
- Not Standardizing Date Formats: Failing to standardize date formats can lead to misinterpretation of data.
- Ignoring Number Formats: Ignoring number formats can result in incorrect comparisons due to differences in decimal places or currency symbols.
- Overlooking Text Case: Overlooking differences in text case can cause the comparison to miss matches.
- Ignoring Units of Measure: Ignoring differences in units of measure can lead to inaccurate results.
- Not Removing Extra Spaces: Not removing extra spaces can cause text comparisons to fail.
7.2. Overlooking Hidden Data
- Failing to Unhide Rows and Columns: Failing to unhide rows and columns can result in missing important data.
- Ignoring Hidden Worksheets: Ignoring hidden worksheets can lead to an incomplete comparison.
- Not Checking for Hidden Comments: Not checking for hidden comments can cause you to miss important information.
- Overlooking Hidden Formulas: Overlooking hidden formulas can lead to incorrect comparisons.
- Not Unhiding Objects: Not unhiding objects, such as charts or images, can cause you to miss important information.
7.3. Using Incorrect Comparison Methods
- Using Manual Comparison for Large Datasets: Using manual comparison for large datasets is time-consuming and error-prone.
- Not Using Appropriate Formulas: Not using appropriate formulas can lead to inaccurate comparisons.
- Using Inefficient Add-ins: Using inefficient add-ins can slow down the comparison process.
- Not Using Database Comparison Techniques: Not using database comparison techniques for complex comparisons can be inefficient.
- Relying on Visual Inspection Alone: Relying on visual inspection alone can lead to missed differences.
7.4. Not Validating the Results
- Not Manually Reviewing a Sample of Results: Not manually reviewing a sample of results can lead to undetected errors.
- Not Comparing Results with Other Sources: Not comparing results with other sources can lead to incorrect conclusions.
- Not Using a Second Person to Review the Results: Not using a second person to review the results can cause you to miss errors.
- Not Documenting the Validation Process: Not documenting the validation process can make it difficult to track errors.
- Not Addressing Any Discrepancies: Not addressing any discrepancies can lead to incorrect data.
7.5. Neglecting Documentation
- Not Recording the Steps Taken: Not recording the steps taken can make it difficult to reproduce the comparison.
- Not Noting Any Assumptions Made: Not noting any assumptions made can lead to misunderstandings.
- Not Listing Any Limitations: Not listing any limitations can cause you to overstate the accuracy of the comparison.
- Not Including Screenshots: Not including screenshots can make it difficult to understand the comparison results.
- Not Storing the Documentation with the Spreadsheets: Not storing the documentation with the spreadsheets can make it difficult to access.
By avoiding these common mistakes, you can improve the accuracy and efficiency of your spreadsheet comparison process and ensure that you are making informed decisions based on reliable data.
8. The Future of Spreadsheet Comparison
The field of spreadsheet comparison is constantly evolving, with new tools and techniques emerging to meet the growing demands of data analysis and decision-making. The future is bright.
8.1. Artificial Intelligence (AI) and Machine Learning (ML)
- Automated Anomaly Detection: AI and ML algorithms can automatically detect anomalies and outliers in spreadsheets, highlighting potential errors or inconsistencies.
- Intelligent Data Cleaning: AI-powered tools can automatically clean and standardize data, reducing the need for manual intervention.
- Predictive Comparison: AI can predict potential differences between spreadsheets based on historical data and trends.
- Natural Language Processing (NLP): NLP can be used to analyze comments and annotations in spreadsheets, providing context and insights into the data.
- Personalized Recommendations: AI can provide personalized recommendations for comparison techniques based on the specific characteristics of the spreadsheets.
8.2. Cloud-Based Collaboration
- Real-Time Collaboration: Cloud-based platforms enable real-time collaboration on spreadsheet comparison, allowing multiple users to work together simultaneously.
- Centralized Data Storage: Cloud storage provides a centralized location for storing and accessing spreadsheets, ensuring data consistency and security.
- Version Control: Cloud-based version control systems track changes to spreadsheets over time, making it easy to revert to previous versions.
- Integration with Other Cloud Services: Cloud-based spreadsheet comparison tools can be integrated with other cloud services, such as data warehouses and business intelligence platforms.
- Mobile Access: Cloud-based platforms allow users to access and compare spreadsheets from any device, anywhere in the world.
8.3. Enhanced Visualization
- Interactive Dashboards: Interactive dashboards provide a dynamic and engaging way to visualize spreadsheet comparison results.
- 3D Visualization: 3D visualization can be used to represent complex data relationships and differences in a more intuitive way.
- Virtual Reality (VR) and Augmented Reality (AR): VR and AR can be used to create immersive spreadsheet comparison experiences, allowing users to explore data in new ways.
- Animated Charts and Graphs: Animated charts and graphs can be used to show changes in data over time, highlighting trends and patterns.
- Customizable Visualizations: Customizable visualizations allow users to tailor the presentation of data to their specific needs.
8.4. Improved Data Security
- Data Encryption: Data encryption protects sensitive information in spreadsheets from unauthorized access.
- Access Controls: Access controls restrict access to spreadsheets based on user roles and permissions.
- Audit Trails: Audit trails track all changes made to spreadsheets, providing a record of who made what changes and when.
- Data Loss Prevention (DLP): DLP systems prevent sensitive data from being leaked or stolen from spreadsheets.
- Compliance with Regulations: Spreadsheet comparison tools are increasingly being designed to comply with industry-specific regulations, such as GDPR and HIPAA.
8.5. Integration with Business Intelligence (BI) Platforms
- Seamless Data Integration: Integration with BI platforms allows users to seamlessly integrate spreadsheet data with other data sources.
- Advanced Analytics: BI platforms provide advanced analytics capabilities, allowing users to perform more sophisticated comparisons and analyses.
- Data Visualization: BI platforms offer a wide range of data visualization options, allowing users to create compelling and informative reports.
- Collaboration and Sharing: BI platforms facilitate collaboration and sharing of spreadsheet comparison results with other users.
- Automated Reporting: BI platforms can automate the generation of spreadsheet comparison reports, saving time and effort.
As technology continues to advance, spreadsheet comparison will become even more powerful and accessible, enabling organizations to make better decisions based on accurate and reliable data.
9. Real-World Examples of Spreadsheet Comparison
Spreadsheet comparison is used in a wide range of industries and applications. These real-world examples illustrate the value and versatility of this technique. Examples speak volumes.
9.1. Financial Auditing
- Comparing Financial Statements: Auditors compare financial statements from different periods to identify discrepancies, fraud, or errors.
- Validating Transactions: Auditors validate transactions by comparing data from different sources, such as bank statements and invoices.
- Analyzing Budget Variances: Auditors analyze budget variances by comparing actual results with budgeted amounts.
- Testing Internal Controls: Auditors test internal controls by comparing data from different systems and departments.
- Detecting Fraudulent Activity: Auditors detect fraudulent activity by comparing data patterns and identifying anomalies.
9.2. Healthcare
- Comparing Patient Data: Healthcare providers compare patient data from different sources, such as electronic health records and lab results.
- Analyzing Clinical Trial Data: Researchers analyze clinical trial data by comparing outcomes for different treatment groups.
- Tracking Disease Outbreaks: Public health officials track disease outbreaks by comparing data on infection rates and demographics.
- Monitoring Healthcare Costs: Healthcare administrators monitor healthcare costs by comparing data on expenditures and utilization.
- Improving Patient Outcomes: Healthcare providers use spreadsheet comparison to identify best practices and improve patient outcomes.
9.3. Retail
- Analyzing Sales Data: Retailers analyze sales data by comparing sales figures from different stores and time periods.
- Tracking Inventory Levels: Retailers track inventory levels by comparing data on stock levels and sales rates.
- Optimizing Pricing Strategies: Retailers optimize pricing strategies by comparing data on prices and demand.
- Managing Customer Loyalty Programs: Retailers manage customer loyalty programs by comparing data on customer purchases and rewards.
- Improving Customer Satisfaction: Retailers use spreadsheet comparison to identify areas for improvement in customer service and product offerings.
9.4. Manufacturing
- Comparing Production Data: Manufacturers compare production data from different plants and shifts.
- Tracking Quality Control Metrics: Manufacturers track quality control metrics by comparing data on defect rates and customer complaints.
- Optimizing Supply Chain Management: Manufacturers optimize supply chain management by comparing data on lead times and inventory costs.
- Managing Equipment Maintenance: Manufacturers manage equipment maintenance by comparing data on equipment performance and repair costs.
- Improving Production Efficiency: Manufacturers use spreadsheet comparison to identify bottlenecks and improve production efficiency.
9.5. Education
- Analyzing Student Performance: Educators analyze student performance by comparing data on grades and test scores.
- Tracking Enrollment Trends: School administrators track enrollment trends by comparing data on student demographics and applications.
- Managing Budgets: School administrators manage budgets by comparing data on revenues and expenditures.
- Evaluating Program Effectiveness: Educators evaluate program effectiveness by comparing data on student outcomes and program costs.
- Improving Educational Outcomes: Educators use spreadsheet comparison to identify best practices and improve educational outcomes.
These examples demonstrate the wide range of applications for spreadsheet comparison and the value it provides in helping organizations make better decisions based on accurate and reliable data.
10. Frequently Asked Questions (FAQ) About Spreadsheet Comparison
Here are some frequently asked questions about spreadsheet comparison, along with detailed answers. Knowledge is power.
10.1. What is spreadsheet comparison?
Spreadsheet comparison is the process of identifying differences between two or more spreadsheets. This can include differences in data values, formulas, formatting, and structure.
10.2. Why is spreadsheet comparison important?
Spreadsheet comparison is important for ensuring data accuracy, tracking changes, identifying errors, and validating data. It is used in a wide range of industries and applications.
10.3. What are some common uses for spreadsheet comparison?
Some common uses for spreadsheet comparison include financial auditing, data migration, version control, sales analysis, inventory management, scientific research, project management, and compliance reporting.
10.4. What are some challenges in comparing spreadsheets?
Some challenges in comparing spreadsheets include large datasets, complex formulas, formatting variations, hidden rows and columns, data types, inconsistent data entry, lack of automation, and password protection.
10.5. What are some of Excel’s built-in comparison features?
Some of Excel’s built-in comparison features include conditional formatting, formula-based comparison, side-by-side view, and the “Go To Special” feature.
10.6. What are some advanced comparison tools and techniques?
Some advanced comparison tools and techniques include Microsoft Spreadsheet Compare, Excel add-ins, database comparison techniques, and programming with VBA (Visual Basic for Applications).
10.7. How can I prepare my spreadsheets for comparison?
You can prepare your spreadsheets for comparison by standardizing data formats, cleaning data for accuracy, structuring data for comparison, and removing irrelevant data.
10.8. What are some best practices for spreadsheet comparison?
Some best practices for spreadsheet comparison include establishing clear comparison objectives, using version control, automating the comparison process, validating the comparison results, and training users on spreadsheet comparison techniques.
10.9. What are some common mistakes to avoid during spreadsheet comparison?
Some common mistakes to avoid during spreadsheet comparison include ignoring data formatting, overlooking hidden data, using incorrect comparison methods, not validating the results, and neglecting documentation.
10.10. What is the future of spreadsheet comparison?
The future of spreadsheet comparison includes artificial intelligence (AI) and machine learning (ML), cloud-based collaboration, enhanced visualization, improved data security, and integration with business intelligence (BI) platforms.
Do you need to compare information in two Excel spreadsheets? Visit COMPARE.EDU.VN today to explore our detailed comparisons and make informed decisions. Contact us at 333 Comparison Plaza, Choice City, CA 90210, United States. Whatsapp: +1 (626) 555-9090. We can help you navigate the complexities of data comparison and achieve your goals. Our commitment to accuracy and objectivity ensures that you have the information you need to make the right choices. Don’t hesitate—visit compare.edu.vn now and start comparing!