Comparing data in Excel to find differences is crucial for data analysis, ensuring accuracy, and making informed decisions. At COMPARE.EDU.VN, we provide comprehensive guides and tools to streamline this process, whether you’re identifying discrepancies, verifying data integrity, or merging datasets. Discover effective strategies for data validation and efficient data reconciliation to make your data handling effortless.
Table of Contents
1. Understanding the Importance of Comparing Data in Excel
- 1.1 Why Compare Data in Excel?
- 1.2 Common Scenarios for Data Comparison
- 1.3 Benefits of Accurate Data Comparison
2. Basic Techniques for Data Comparison in Excel
- 2.1 Manual Comparison: When Is It Appropriate?
- 2.2 Using the Equals Operator (=) for Direct Comparison
- 2.3 Applying Conditional Formatting for Visual Cues
3. Advanced Formulas for In-Depth Data Comparison
- 3.1 Leveraging the IF Function for Binary Outcomes
- 3.2 Using the EXACT Function for Case-Sensitive Comparisons
- 3.3 Combining IF and AND/OR Functions for Complex Criteria
4. Utilizing Excel Functions for Data Matching and Mismatch Detection
- 4.1 VLOOKUP, HLOOKUP, and XLOOKUP for Data Retrieval and Comparison
- 4.2 MATCH and INDEX Functions for Dynamic Data Matching
- 4.3 Using COUNTIF and COUNTIFS for Frequency Analysis and Comparison
5. Conditional Formatting Techniques for Highlighting Differences
- 5.1 Highlighting Unique Values
- 5.2 Highlighting Duplicate Values
- 5.3 Creating Custom Rules for Specific Comparison Needs
6. Comparing Data Across Multiple Worksheets and Workbooks
- 6.1 Referencing Cells and Ranges in Different Sheets
- 6.2 Using 3D Formulas for Consolidated Comparisons
- 6.3 Linking Workbooks for Real-Time Data Synchronization
7. Data Comparison with Power Query
- 7.1 Importing Data from Various Sources
- 7.2 Merging and Appending Data
- 7.3 Identifying Differences with Power Query Transformations
8. Advanced Techniques for Large Datasets
- 8.1 Using Array Formulas for Efficient Data Processing
- 8.2 Implementing Pivot Tables for Summarization and Comparison
- 8.3 Utilizing Excel’s Data Model for Complex Relationships
9. Best Practices for Data Comparison in Excel
- 9.1 Ensuring Data Consistency and Accuracy
- 9.2 Documenting Comparison Methods and Results
- 9.3 Regularly Auditing Data Comparison Processes
10. Real-World Examples and Case Studies
- 10.1 Comparing Sales Data Across Regions
- 10.2 Analyzing Customer Feedback
- 10.3 Identifying Inventory Discrepancies
11. Troubleshooting Common Issues in Data Comparison
- 11.1 Addressing Data Type Mismatches
- 11.2 Handling Errors and Unexpected Results
- 11.3 Optimizing Performance for Large Datasets
12. Automating Data Comparison with VBA
- 12.1 Introduction to VBA for Data Analysis
- 12.2 Writing VBA Scripts for Automated Comparison
- 12.3 Creating Custom Functions for Specific Comparison Tasks
13. Tips and Tricks for Efficient Data Comparison
- 13.1 Using Keyboard Shortcuts for Faster Navigation
- 13.2 Customizing Excel Settings for Data Analysis
- 13.3 Leveraging Add-Ins for Enhanced Functionality
14. The Future of Data Comparison in Excel
- 14.1 Integration with Cloud Services
- 14.2 Advancements in AI and Machine Learning
- 14.3 Enhanced Visualization Tools
15. COMPARE.EDU.VN: Your Partner in Data Comparison
- 15.1 How COMPARE.EDU.VN Simplifies Data Analysis
- 15.2 Success Stories from Our Users
- 15.3 Resources and Support for Excel Users
16. FAQ: Frequently Asked Questions
1. Understanding the Importance of Comparing Data in Excel
1.1 Why Compare Data in Excel?
Comparing data in Excel is essential for verifying accuracy, identifying discrepancies, and making informed decisions. It helps users ensure data integrity, reconcile datasets, and gain insights from their information. Whether you are comparing product lists, financial records, or survey responses, the ability to accurately compare data is crucial for maintaining data quality and reliability.
1.2 Common Scenarios for Data Comparison
Data comparison in Excel is useful in numerous scenarios across various industries. These include:
- Financial Analysis: Comparing budget versus actual expenses, reconciling bank statements, and auditing financial records.
- Sales and Marketing: Analyzing sales performance across different regions, comparing marketing campaign results, and tracking customer behavior.
- Inventory Management: Identifying discrepancies in stock levels, comparing inventory counts, and tracking product movements.
- Human Resources: Comparing employee performance metrics, analyzing salary data, and tracking employee attendance.
- Research and Development: Comparing experimental results, analyzing survey data, and validating research findings.
1.3 Benefits of Accurate Data Comparison
Accurate data comparison offers several significant benefits:
- Improved Decision-Making: Reliable data ensures that decisions are based on accurate and up-to-date information.
- Reduced Errors: Identifying and correcting errors minimizes the risk of costly mistakes and inefficiencies.
- Enhanced Data Quality: Regular data comparison helps maintain the integrity and consistency of data.
- Time Savings: Efficient comparison techniques save time and effort compared to manual methods.
- Better Insights: Discovering patterns, trends, and anomalies in data leads to valuable insights and opportunities.
2. Basic Techniques for Data Comparison in Excel
2.1 Manual Comparison: When Is It Appropriate?
Manual comparison involves visually inspecting data in two or more columns or sheets and noting the differences. While this method is time-consuming and prone to errors, it can be appropriate for small datasets or one-time comparisons. It is best suited when you need to quickly verify a small number of entries or when the differences are easily noticeable.
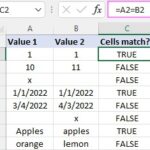
2.2 Using the Equals Operator (=) for Direct Comparison
The equals operator (=) is a simple yet effective way to compare two cells in Excel. By entering a formula like =A1=B1, Excel returns TRUE if the values in cells A1 and B1 are identical, and FALSE otherwise. This method is useful for quick, row-by-row comparisons and can be easily extended to entire columns by dragging the formula down.
2.3 Applying Conditional Formatting for Visual Cues
Conditional formatting allows you to automatically highlight cells based on specific criteria. To compare two columns, select the columns, go to Home > Conditional Formatting > Highlight Cells Rules, and choose options like Duplicate Values or Unique Values. This method visually identifies matching or differing entries, making it easier to spot patterns and anomalies.
3. Advanced Formulas for In-Depth Data Comparison
3.1 Leveraging the IF Function for Binary Outcomes
The IF function allows you to perform logical tests and return different values based on the outcome. For example, the formula =IF(A1=B1, "Match", "Mismatch") compares the values in cells A1 and B1 and returns “Match” if they are equal, and “Mismatch” if they are not. This function is invaluable for creating custom comparison reports.
3.2 Using the EXACT Function for Case-Sensitive Comparisons
The EXACT function compares two text strings and returns TRUE only if they are exactly the same, including case. The formula =EXACT(A1, B1) is case-sensitive, meaning that “Excel” and “excel” will be considered different. This function is useful when case sensitivity is important, such as when comparing usernames or product codes.
3.3 Combining IF and AND/OR Functions for Complex Criteria
For more complex comparisons, you can combine the IF function with AND and OR functions. For example, =IF(AND(A1>10, B1<20), "Valid", "Invalid") checks if the value in A1 is greater than 10 AND the value in B1 is less than 20. Similarly, =IF(OR(A1="Yes", B1="Yes"), "Confirmed", "Pending") checks if either A1 or B1 is “Yes”. These combinations allow for highly customizable comparison criteria.
4. Utilizing Excel Functions for Data Matching and Mismatch Detection
4.1 VLOOKUP, HLOOKUP, and XLOOKUP for Data Retrieval and Comparison
The VLOOKUP (Vertical Lookup), HLOOKUP (Horizontal Lookup), and XLOOKUP functions are powerful tools for retrieving and comparing data from different columns or tables. VLOOKUP searches for a value in the first column of a range and returns a value from a specified column in the same row. HLOOKUP does the same but searches in the first row. XLOOKUP is a more versatile function that can search in any direction and handle errors more effectively.
For example, =VLOOKUP(A1, Sheet2!A:B, 2, FALSE) searches for the value in A1 in the first column of Sheet2 and returns the corresponding value from the second column.
4.2 MATCH and INDEX Functions for Dynamic Data Matching
The MATCH function returns the position of a value in a range, while the INDEX function returns the value at a specific position in a range. Combining these functions allows for dynamic data matching. For example, =INDEX(B:B, MATCH(A1, A:A, 0)) finds the position of the value in A1 in column A and returns the corresponding value from column B.
4.3 Using COUNTIF and COUNTIFS for Frequency Analysis and Comparison
The COUNTIF function counts the number of cells in a range that meet a single criterion, while COUNTIFS allows for multiple criteria. These functions are useful for frequency analysis and comparison. For example, =COUNTIF(A:A, B1) counts how many times the value in B1 appears in column A. =COUNTIFS(A:A, ">10", B:B, "<20") counts the number of rows where the value in column A is greater than 10 and the value in column B is less than 20.
5. Conditional Formatting Techniques for Highlighting Differences
5.1 Highlighting Unique Values
To highlight unique values in a column, select the column, go to Home > Conditional Formatting > Highlight Cells Rules > Duplicate Values, and choose Unique from the dropdown menu. This highlights all the values that appear only once in the selected range.
5.2 Highlighting Duplicate Values
To highlight duplicate values, follow the same steps as above but choose Duplicate from the dropdown menu. This highlights all the values that appear more than once in the selected range.
5.3 Creating Custom Rules for Specific Comparison Needs
Excel allows you to create custom conditional formatting rules based on formulas. To do this, select the range, go to Home > Conditional Formatting > New Rule, and choose Use a formula to determine which cells to format. Enter a formula that evaluates to TRUE or FALSE and specify the formatting to apply when the formula is TRUE. For example, to highlight rows where the value in column A is greater than the value in column B, you can use the formula =$A1>$B1.
6. Comparing Data Across Multiple Worksheets and Workbooks
6.1 Referencing Cells and Ranges in Different Sheets
To compare data across multiple worksheets, you can reference cells and ranges in different sheets using the sheet name followed by an exclamation mark. For example, to compare cell A1 in Sheet1 with cell A1 in Sheet2, you can use the formula =Sheet1!A1=Sheet2!A1.
6.2 Using 3D Formulas for Consolidated Comparisons
3D formulas allow you to perform calculations across multiple sheets with a similar structure. For example, to sum the values in cell A1 across Sheet1, Sheet2, and Sheet3, you can use the formula =SUM(Sheet1:Sheet3!A1). This is useful for consolidating data from multiple sources.
6.3 Linking Workbooks for Real-Time Data Synchronization
Linking workbooks allows you to create formulas that reference cells in other Excel files. To do this, enter the full path to the other workbook in the formula. For example, ='C:Documents[Workbook2.xlsx]Sheet1'!A1 references cell A1 in Sheet1 of Workbook2.xlsx. When the source workbook is updated, the linked formulas in the destination workbook will automatically update.
7. Data Comparison with Power Query
7.1 Importing Data from Various Sources
Power Query is a powerful data transformation and analysis tool in Excel. It allows you to import data from various sources, including Excel files, CSV files, databases, and web pages. To import data, go to Data > Get & Transform Data and choose the appropriate data source.
7.2 Merging and Appending Data
Power Query allows you to merge and append data from multiple sources. Merging combines data from two or more tables based on a common column, while appending adds rows from one table to another. These operations are useful for consolidating data from different sources into a single table.
7.3 Identifying Differences with Power Query Transformations
Power Query provides various transformations for identifying differences in data. You can use the Merge Queries transformation to perform a left anti-join, which returns only the rows from the left table that do not have a match in the right table. This is useful for finding missing data or discrepancies between datasets.
8. Advanced Techniques for Large Datasets
8.1 Using Array Formulas for Efficient Data Processing
Array formulas allow you to perform calculations on entire arrays of data rather than individual cells. These formulas can be more efficient for processing large datasets. To enter an array formula, type the formula and press Ctrl+Shift+Enter. For example, to compare two columns and return an array of “Match” or “Mismatch” results, you can use the formula =IF(A1:A10=B1:B10, "Match", "Mismatch").
8.2 Implementing Pivot Tables for Summarization and Comparison
Pivot tables are powerful tools for summarizing and comparing data. They allow you to group data by different categories and perform calculations such as sums, averages, and counts. You can use pivot tables to compare data across different dimensions and identify patterns and trends.
8.3 Utilizing Excel’s Data Model for Complex Relationships
Excel’s Data Model allows you to create relationships between multiple tables and perform complex data analysis. This is useful for working with large datasets that are stored in multiple tables. You can use the Data Model to create calculated columns, measures, and relationships to analyze and compare data across different tables.
9. Best Practices for Data Comparison in Excel
9.1 Ensuring Data Consistency and Accuracy
Before comparing data, it is essential to ensure that the data is consistent and accurate. This includes cleaning the data to remove errors, inconsistencies, and duplicates. You should also standardize data formats and ensure that all data is entered correctly.
9.2 Documenting Comparison Methods and Results
It is important to document the methods used for data comparison and the results obtained. This includes documenting the formulas used, the conditional formatting rules applied, and any transformations performed. This documentation helps ensure that the comparison process is transparent and reproducible.
9.3 Regularly Auditing Data Comparison Processes
Data comparison processes should be regularly audited to ensure that they are accurate and effective. This includes reviewing the comparison methods, verifying the results, and updating the processes as needed. Regular audits help maintain the quality and reliability of data.
10. Real-World Examples and Case Studies
10.1 Comparing Sales Data Across Regions
A company wants to compare sales data across different regions to identify top-performing regions and areas for improvement. They use Excel to consolidate sales data from different regional offices and create a pivot table to summarize sales by region. They then use conditional formatting to highlight regions with the highest and lowest sales.
10.2 Analyzing Customer Feedback
A company wants to analyze customer feedback from surveys to identify common themes and areas for improvement. They use Excel to import survey data and use the COUNTIF function to count the number of times each theme is mentioned in the feedback. They then create a chart to visualize the results and identify the most common themes.
10.3 Identifying Inventory Discrepancies
A retail company wants to identify discrepancies in their inventory records. They use Excel to compare inventory counts from different warehouses and use the VLOOKUP function to match product IDs. They then use conditional formatting to highlight products with significant discrepancies.
11. Troubleshooting Common Issues in Data Comparison
11.1 Addressing Data Type Mismatches
Data type mismatches can cause errors in data comparison. For example, if one column contains numbers and another column contains text, Excel may not be able to compare the values correctly. To address this issue, you can use the TEXT function to convert numbers to text or the VALUE function to convert text to numbers.
11.2 Handling Errors and Unexpected Results
Errors and unexpected results can occur in data comparison due to various reasons, such as incorrect formulas, missing data, or data inconsistencies. To troubleshoot these issues, you can use Excel’s error-checking tools, such as the Trace Error feature, to identify the source of the error. You can also use the IFERROR function to handle errors gracefully and return a specific value when an error occurs.
11.3 Optimizing Performance for Large Datasets
Comparing large datasets can be slow and resource-intensive. To optimize performance, you can use techniques such as disabling automatic calculations, using array formulas, and using Excel’s Data Model. You can also close any unnecessary workbooks and applications to free up memory.
12. Automating Data Comparison with VBA
12.1 Introduction to VBA for Data Analysis
VBA (Visual Basic for Applications) is a programming language that can be used to automate tasks in Excel. VBA allows you to write custom code to perform complex data analysis and comparison tasks.
12.2 Writing VBA Scripts for Automated Comparison
You can write VBA scripts to automate data comparison tasks, such as comparing two columns, highlighting differences, and generating reports. To write a VBA script, press Alt+F11 to open the VBA editor and insert a new module. Then, write the code to perform the desired task.
12.3 Creating Custom Functions for Specific Comparison Tasks
You can create custom functions in VBA to perform specific comparison tasks. A custom function is a user-defined function that can be used in Excel formulas. To create a custom function, write a VBA function in a module and save the workbook. Then, you can use the function in Excel formulas like any other built-in function.
13. Tips and Tricks for Efficient Data Comparison
13.1 Using Keyboard Shortcuts for Faster Navigation
Using keyboard shortcuts can significantly speed up data comparison tasks. Some useful shortcuts include:
- Ctrl+Arrow Keys: Move to the edge of the current data region.
- Ctrl+Shift+Arrow Keys: Select the current data region.
- Ctrl+Space: Select the entire column.
- Shift+Space: Select the entire row.
- Ctrl+F: Open the Find dialog box.
- Ctrl+H: Open the Replace dialog box.
13.2 Customizing Excel Settings for Data Analysis
Customizing Excel settings can improve efficiency and accuracy in data analysis. Some useful settings include:
- Autosave: Enable autosave to prevent data loss.
- Calculation Options: Set calculation options to manual for large datasets.
- Error Checking: Enable error checking to identify potential errors.
- Customize Ribbon: Add frequently used commands to the ribbon for quick access.
13.3 Leveraging Add-Ins for Enhanced Functionality
Excel add-ins can enhance functionality and provide additional tools for data comparison. Some useful add-ins include:
- Power Query: For data import and transformation.
- Power Pivot: For data modeling and analysis.
- Solver: For optimization and scenario analysis.
- XLSTAT: For statistical analysis and data mining.
14. The Future of Data Comparison in Excel
14.1 Integration with Cloud Services
The future of data comparison in Excel will likely involve greater integration with cloud services such as Microsoft Azure, Google Cloud, and Amazon Web Services. This will allow users to access and compare data from a wider range of sources and collaborate more effectively.
14.2 Advancements in AI and Machine Learning
Advancements in AI and machine learning will likely lead to more intelligent and automated data comparison tools in Excel. These tools will be able to automatically identify patterns, anomalies, and discrepancies in data, and provide insights that would be difficult to discover manually.
14.3 Enhanced Visualization Tools
Enhanced visualization tools will make it easier to understand and communicate the results of data comparison. These tools will allow users to create interactive charts, graphs, and dashboards that can be used to explore data and identify trends.
15. COMPARE.EDU.VN: Your Partner in Data Comparison
15.1 How COMPARE.EDU.VN Simplifies Data Analysis
COMPARE.EDU.VN offers comprehensive guides and resources to simplify data analysis in Excel. Our tutorials, templates, and tools help users of all skill levels perform data comparison tasks more efficiently and accurately.
15.2 Success Stories from Our Users
Many users have found COMPARE.EDU.VN to be an invaluable resource for data analysis. Here are a few success stories:
- Sarah, a financial analyst: “COMPARE.EDU.VN helped me streamline my financial analysis tasks and improve the accuracy of my reports.”
- John, a marketing manager: “Thanks to COMPARE.EDU.VN, I can now analyze customer feedback more efficiently and identify areas for improvement.”
- Emily, an inventory manager: “COMPARE.EDU.VN helped me identify discrepancies in my inventory records and reduce losses.”
15.3 Resources and Support for Excel Users
COMPARE.EDU.VN provides a wide range of resources and support for Excel users, including:
- Tutorials: Step-by-step guides on data comparison techniques.
- Templates: Pre-built Excel templates for common data analysis tasks.
- Tools: Custom Excel tools for automating data comparison.
- Community Forum: A forum where users can ask questions and share tips.
- Customer Support: Email and phone support for assistance with data analysis.
Visit COMPARE.EDU.VN today to discover how we can help you simplify data analysis and make more informed decisions. Our resources are designed to empower you with the knowledge and tools needed to excel in data comparison.
Are you struggling to compare data in Excel and make sense of it all? Visit COMPARE.EDU.VN at 333 Comparison Plaza, Choice City, CA 90210, United States, or contact us via Whatsapp at +1 (626) 555-9090 to find detailed comparisons and make confident decisions today. Let COMPARE.EDU.VN be your guide in the world of data analysis
16. FAQ: Frequently Asked Questions
Q1: What is the best way to compare two columns in Excel for differences?
A: The best way depends on your specific needs. For a quick visual comparison, use conditional formatting to highlight unique values. For a more detailed comparison, use the IF function with the equals operator or the EXACT function for case-sensitive comparisons.
Q2: How can I compare data across multiple worksheets in Excel?
A: You can reference cells and ranges in different sheets using the sheet name followed by an exclamation mark (e.g., =Sheet1!A1=Sheet2!A1). You can also use 3D formulas to perform calculations across multiple sheets with a similar structure.
Q3: Can I automate data comparison in Excel?
A: Yes, you can automate data comparison using VBA (Visual Basic for Applications). You can write VBA scripts to perform complex data analysis and comparison tasks, such as comparing two columns, highlighting differences, and generating reports.
Q4: How do I handle data type mismatches when comparing data in Excel?
A: Data type mismatches can cause errors in data comparison. To address this issue, you can use the TEXT function to convert numbers to text or the VALUE function to convert text to numbers.
Q5: What is Power Query, and how can it help with data comparison?
A: Power Query is a powerful data transformation and analysis tool in Excel. It allows you to import data from various sources, merge and append data, and identify differences with Power Query transformations.
Q6: How can I optimize performance when comparing large datasets in Excel?
A: To optimize performance when comparing large datasets, you can use techniques such as disabling automatic calculations, using array formulas, and using Excel’s Data Model. You can also close any unnecessary workbooks and applications to free up memory.
Q7: What are some common errors to watch out for when comparing data in Excel?
A: Common errors to watch out for include data type mismatches, incorrect formulas, missing data, and data inconsistencies. Use Excel’s error-checking tools and the IFERROR function to handle errors gracefully.
Q8: What are some advanced techniques for data comparison in Excel?
A: Advanced techniques include using array formulas for efficient data processing, implementing pivot tables for summarization and comparison, and utilizing Excel’s Data Model for complex relationships.
Q9: How can conditional formatting help with data comparison?
A: Conditional formatting allows you to automatically highlight cells based on specific criteria, making it easier to spot patterns and anomalies. You can use conditional formatting to highlight unique values, duplicate values, and cells that meet specific comparison criteria.
Q10: Where can I find more resources and support for data comparison in Excel?
A: compare.edu.vn offers comprehensive guides, tutorials, templates, and tools to simplify data analysis in Excel. Visit our website for more information and support.