Compare Aggregate and Non-Aggregate Tableau calculations with COMPARE.EDU.VN to elevate your data analysis skills and gain deeper insights. This guide explores the critical differences between aggregated and non-aggregated calculations in Tableau, providing clear examples and explanations to help you choose the right approach for your specific analytical needs. Discover how COMPARE.EDU.VN empowers you to make informed decisions and unlock the full potential of your data visualizations.
1. Understanding Aggregation in Tableau
Aggregation in Tableau involves summarizing data to derive meaningful insights, transforming raw data points into concise and understandable metrics. Tableau automatically aggregates measures by default when you drag them onto the view, displaying SUM(Sales) instead of individual sales transactions, for example. This inherent aggregation feature simplifies data analysis by providing summarized views that reveal trends and patterns.
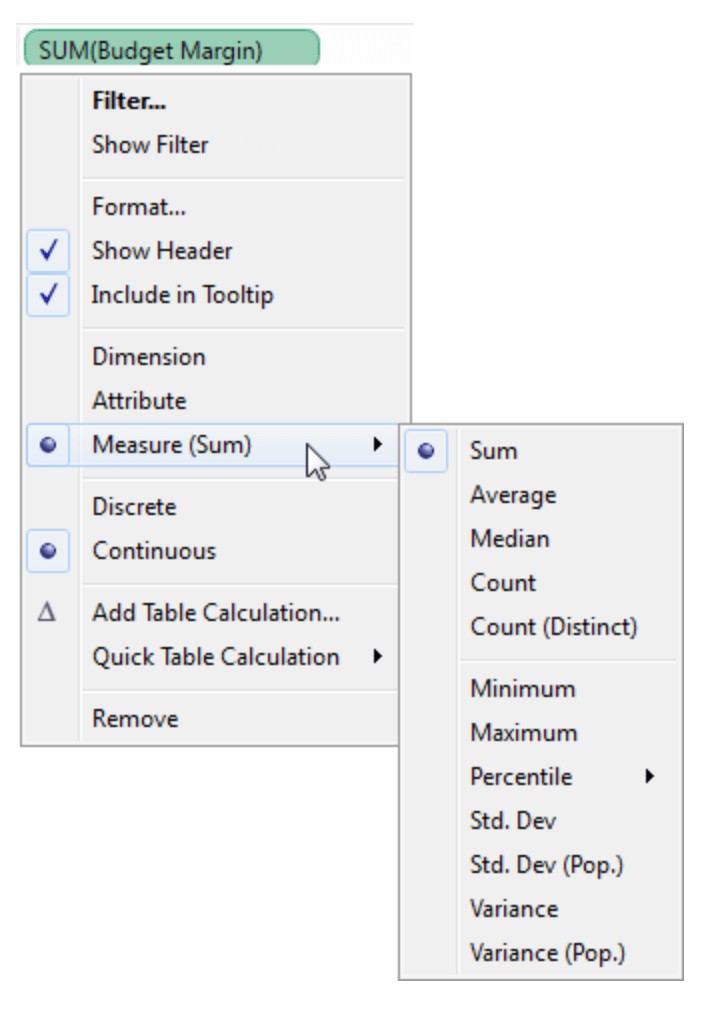
The core idea behind aggregation is to group data points based on specific dimensions and then apply a function to calculate a summary value for each group. These functions, such as SUM, AVG, MIN, MAX, and COUNT, allow you to analyze data at different levels of granularity. Aggregation is not limited to measures; dimensions can also be aggregated, although the types of aggregations available for dimensions are more restricted.
1.1. Automatic Aggregation
Tableau’s automatic aggregation is a powerful feature that simplifies data analysis, but it’s essential to understand how it works to ensure you’re interpreting the data correctly. When you drag a measure onto the view, Tableau automatically applies a default aggregation, typically SUM, to provide an initial summary of the data.
This automatic aggregation is context-aware, meaning it adjusts based on the dimensions present in the view. For example, if you have ‘Sales’ and ‘Region’ in the view, Tableau calculates the sum of sales for each region, providing a regional breakdown of sales performance. This dynamic aggregation allows you to quickly explore data at different levels of granularity.
1.2. Types of Aggregation
Tableau offers a variety of aggregation functions to suit different analytical needs. The choice of aggregation function depends on the type of data and the specific insights you’re trying to uncover. Here are some common aggregation functions in Tableau:
- SUM: Calculates the total of all values in a group. Useful for understanding overall totals and contributions.
- AVG: Calculates the average of all values in a group. Useful for understanding central tendencies and typical values.
- MIN: Returns the smallest value in a group. Useful for identifying minimum thresholds or outlier values.
- MAX: Returns the largest value in a group. Useful for identifying maximum thresholds or peak values.
- COUNT: Counts the number of records in a group. Useful for understanding the size or frequency of different categories.
- COUNTD: Counts the distinct number of values in a group. Useful for understanding the diversity or uniqueness of different categories.
- MEDIAN: Returns the median value in a group. Useful for understanding the middle value and reducing the impact of outliers.
- ATTR: Returns a single value if all values in the group are identical; otherwise, it returns an asterisk (*). Useful for verifying data consistency within groups.
- STDEV: Calculates the standard deviation of values in a group. Useful for understanding the spread or variability of the data.
- VAR: Calculates the variance of values in a group. Useful for understanding the overall dispersion of the data.
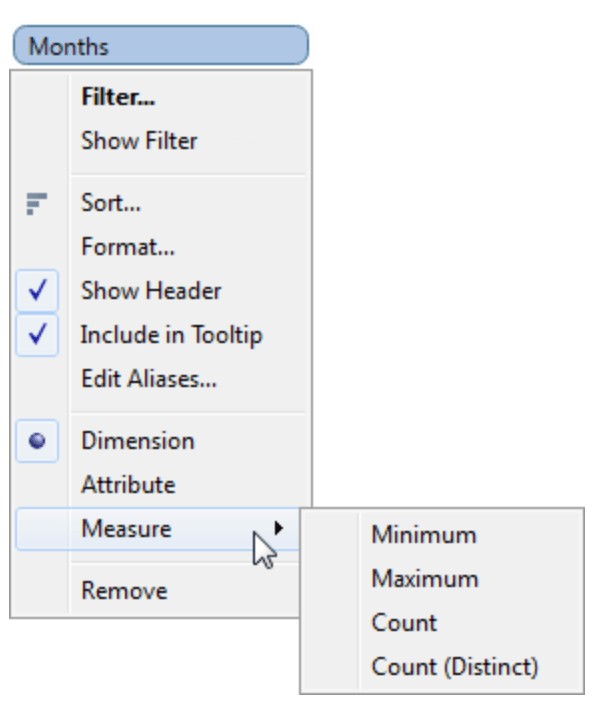
1.3. Aggregating Dimensions
While measures are commonly aggregated, dimensions can also be aggregated in Tableau, although the options are more limited. Dimension aggregation typically involves counting the number of distinct values or finding the attribute value that occurs most frequently.
- COUNT: Counts the number of records associated with each dimension value. Useful for understanding the frequency or popularity of different categories.
- COUNTD: Counts the distinct number of dimension values. Useful for understanding the diversity or uniqueness of different categories.
- ATTR: Returns a single value if all values in the group are identical; otherwise, it returns an asterisk (*). Useful for verifying data consistency within groups.
- MIN: Returns the smallest value in a group.
- MAX: Returns the largest value in a group.
2. Calculations with Aggregated Fields
Calculated fields in Tableau allow you to create new data based on existing fields, enabling more complex analysis and customized metrics. When working with aggregated fields in calculations, you’re essentially performing calculations on summarized data, which can provide high-level insights and trends.
Aggregated calculations are particularly useful when you want to compare aggregated values across different dimensions or create ratios and percentages based on summarized data. For example, you might want to calculate the profit margin for each product category or the average sales per region.
2.1. Syntax for Aggregated Calculations
The syntax for creating aggregated calculations in Tableau involves using aggregation functions within the calculated field formula. The basic structure is AGGREGATION_FUNCTION(Field), where AGGREGATION_FUNCTION is one of the aggregation functions listed earlier (SUM, AVG, MIN, MAX, etc.) and Field is the measure or dimension you want to aggregate.
For example, to calculate the total sales, you would use the formula SUM([Sales]). To calculate the average profit, you would use the formula AVG([Profit]).
2.2. Examples of Aggregated Calculations
Here are some examples of aggregated calculations that demonstrate how to use them in different scenarios:
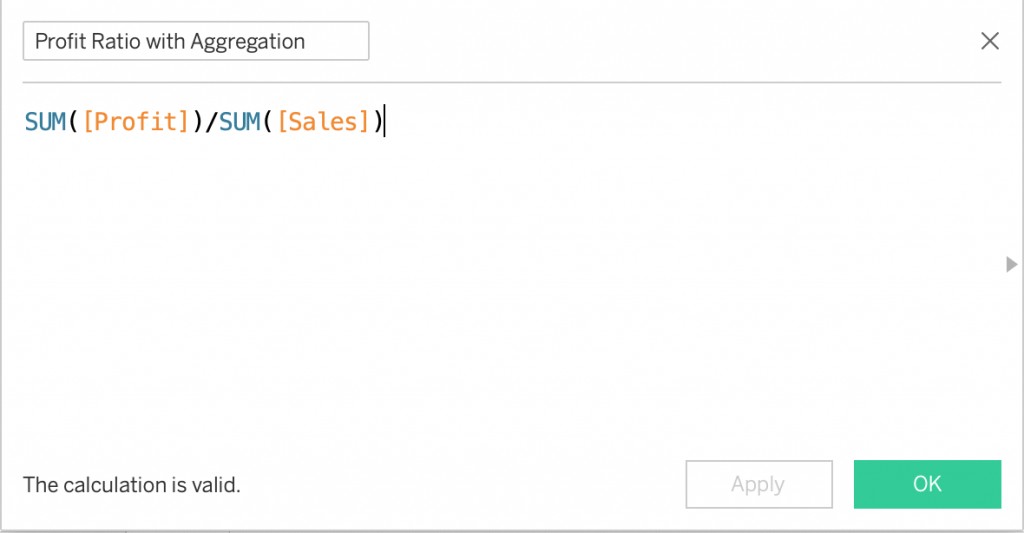
- Profit Margin:
SUM([Profit]) / SUM([Sales]). This calculation returns the profit margin as a decimal. To display it as a percentage, you can format the field as a percentage. - Average Order Size:
SUM([Sales]) / COUNTD([Order ID]). This calculation returns the average sales amount per order. - Sales Growth:
(SUM([Sales]) - LOOKUP(SUM([Sales]), -1)) / LOOKUP(SUM([Sales]), -1). This calculation returns the percentage change in sales compared to the previous period. It requires the use of table calculations to access data from previous rows or columns. - Customer Lifetime Value (CLTV):
AVG([Sales]) * AVG([Repeat Purchases]) * AVG([Customer Lifespan]). This calculation provides an estimate of the total revenue a customer is expected to generate throughout their relationship with the company. It requires defining metrics such as average sales, repeat purchases, and customer lifespan.
2.3. Level of Detail (LOD) Expressions
Level of Detail (LOD) expressions allow you to perform calculations at different levels of granularity than the view’s current level. They provide a powerful way to aggregate data based on specific dimensions, regardless of the dimensions included in the visualization.
There are three types of LOD expressions:
- FIXED: Calculates a value using the specified dimensions, regardless of the dimensions in the view.
- INCLUDE: Calculates a value including the specified dimensions in addition to the dimensions in the view.
- EXCLUDE: Calculates a value excluding the specified dimensions from the dimensions in the view.
LOD expressions are particularly useful when you want to compare aggregated values across different levels of detail. For example, you might want to calculate the sales for each customer and then compare each customer’s sales to the average sales for their region.
3. Calculations with Non-Aggregated Fields
Non-aggregated calculations in Tableau involve performing calculations on individual data points, rather than summarized data. This approach is useful when you need to analyze data at the most granular level and perform calculations that depend on the specific values of each record.
Non-aggregated calculations are often used to create flags or categories based on individual record values, or to perform record-level transformations or calculations. For example, you might want to categorize customers based on their individual purchase amounts or calculate the discount applied to each order.
3.1. Syntax for Non-Aggregated Calculations
The syntax for creating non-aggregated calculations in Tableau is straightforward: simply use the field names in your formula without any aggregation functions. The calculation will be performed on each individual record in the data source.
For example, to calculate the discount amount, you would use the formula [Price] * [Discount]. To determine if an order qualifies for free shipping, you might use the formula IF [Order Total] >= 50 THEN "Free Shipping" ELSE "Standard Shipping" END.
3.2. Examples of Non-Aggregated Calculations
Here are some examples of non-aggregated calculations that demonstrate how to use them in different scenarios:
- Discount Amount:
[Price] * [Discount]. This calculation returns the amount of discount applied to each product. - Shipping Cost:
IF [Order Total] >= 50 THEN 0 ELSE 5 END. This calculation returns the shipping cost for each order, based on the order total. - Customer Segment:
IF [Total Spend] > 1000 THEN "High Value" ELSEIF [Total Spend] > 500 THEN "Medium Value" ELSE "Low Value" END. This calculation categorizes customers into segments based on their total spending. - Profit per Unit:
[Profit] / [Quantity]. This calculation returns the profit earned for each unit sold.
3.3. Row-Level Calculations
Row-level calculations are non-aggregated calculations that are performed on each individual row of data. They are useful for creating flags, categories, or performing transformations based on the specific values of each record.
Row-level calculations can be combined with conditional statements (IF, ELSEIF, ELSE) to create more complex logic. For example, you might want to create a flag that identifies orders that are both high-value and have a high discount: IF [Order Total] > 100 AND [Discount] > 0.2 THEN "High Value & High Discount" ELSE "Other" END.
4. Key Differences Between Aggregate and Non-Aggregate Calculations
The key difference between aggregate and non-aggregate calculations lies in the level of data on which the calculation is performed. Aggregate calculations operate on summarized data, while non-aggregate calculations operate on individual data points.
| Feature | Aggregate Calculations | Non-Aggregate Calculations |
|---|---|---|
| Data Level | Operates on summarized data | Operates on individual data points |
| Aggregation | Uses aggregation functions (SUM, AVG, MIN, MAX, etc.) | Does not use aggregation functions |
| Granularity | Provides high-level insights and trends | Provides detailed analysis at the most granular level |
| Use Cases | Comparing aggregated values, creating ratios and percentages | Creating flags or categories, performing record-level transformations |
| Performance | Can be faster for large datasets | Can be slower for large datasets |
| Example | SUM([Profit]) / SUM([Sales]) |
[Price] * [Discount] |
| Tableau Syntax | AGGREGATION_FUNCTION(Field) |
Field1 * Field2 |
4.1. Understanding the Impact on Results
The choice between aggregate and non-aggregate calculations can significantly impact the results of your analysis. Using the wrong type of calculation can lead to inaccurate or misleading insights.
For example, if you want to calculate the average discount for each product category, you should use an aggregate calculation: AVG([Discount]). This will calculate the average discount across all products within each category. However, if you want to calculate the discount amount for each individual product, you should use a non-aggregate calculation: [Price] * [Discount]. This will calculate the discount amount for each product based on its price and discount rate.
4.2. Identifying the Right Approach
To identify the right approach, consider the level of detail required for your analysis and the type of insights you’re trying to uncover.
If you need to analyze data at a high level and compare aggregated values, use aggregate calculations. If you need to analyze data at the most granular level and perform calculations on individual data points, use non-aggregate calculations.
Consider the following questions to guide your decision:
- What is the unit of analysis? (e.g., customer, product, order)
- What type of calculation are you performing? (e.g., sum, average, ratio)
- What level of detail do you need? (e.g., individual record, group of records)
- What insights are you trying to uncover? (e.g., trends, patterns, outliers)
5. Practical Examples: Profit to Sales Ratio
To further illustrate the difference between aggregate and non-aggregate calculations, let’s consider the example of calculating the profit to sales ratio. This ratio provides a measure of profitability by comparing the amount of profit generated to the amount of sales revenue.
5.1. Aggregate Calculation: SUM([Profit]) / SUM([Sales])
This calculation first aggregates the profit and sales values across all records in the data source, and then divides the total profit by the total sales. This provides an overall profit to sales ratio for the entire dataset.
The advantage of this approach is that it provides a concise summary of profitability. However, it does not provide insights into the profitability of individual products or customers.
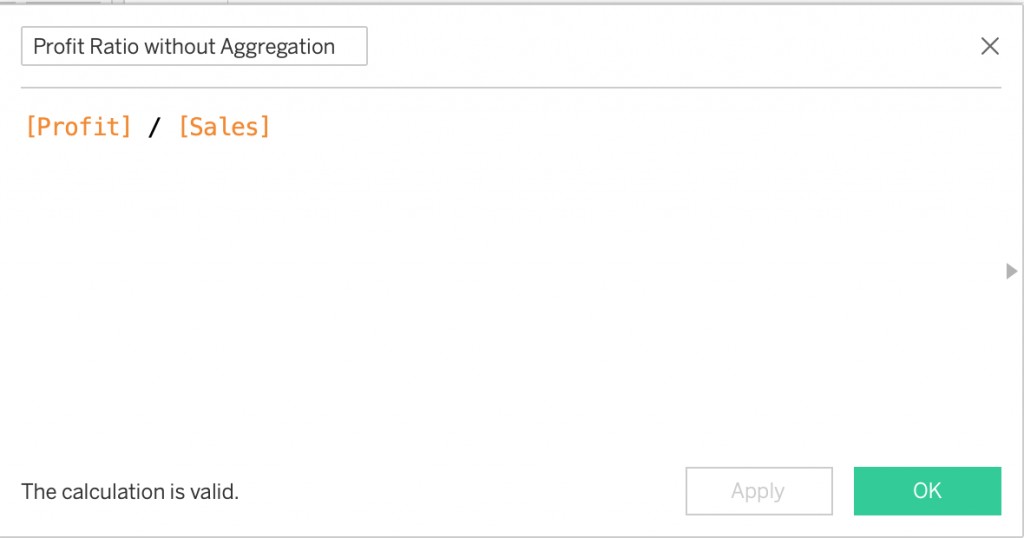
5.2. Non-Aggregate Calculation: [Profit] / [Sales]
This calculation divides the profit by the sales for each individual record in the data source. This provides a profit to sales ratio for each product, customer, or order.
The advantage of this approach is that it provides more granular insights into profitability. However, it can be more difficult to interpret the results, as you will have a large number of individual ratios.
5.3. Comparing the Results
The results of the aggregate and non-aggregate calculations will be different. The aggregate calculation will provide a single profit to sales ratio for the entire dataset, while the non-aggregate calculation will provide a profit to sales ratio for each individual record.
Which calculation is more appropriate depends on the specific analytical question you’re trying to answer. If you want to understand the overall profitability of the company, the aggregate calculation is more appropriate. If you want to identify which products or customers are most profitable, the non-aggregate calculation is more appropriate.
5.4. Choosing the Right Approach
When choosing between aggregate and non-aggregate calculations, consider the following factors:
- Level of detail: Do you need to analyze profitability at a high level or at a granular level?
- Analytical question: What specific question are you trying to answer?
- Data size: Are you working with a large dataset or a small dataset?
- Performance: How quickly do you need to generate the results?
6. Best Practices for Using Aggregate and Non-Aggregate Calculations
To ensure accurate and meaningful results, follow these best practices when working with aggregate and non-aggregate calculations in Tableau:
- Understand your data: Before performing any calculations, take the time to understand your data and the relationships between the fields.
- Define your analytical question: Clearly define the question you’re trying to answer before choosing an aggregation method.
- Choose the right aggregation function: Select the aggregation function that is appropriate for your data and analytical question.
- Use LOD expressions when necessary: Use LOD expressions to perform calculations at different levels of granularity than the view’s current level.
- Test your calculations: Always test your calculations to ensure they are producing the correct results.
- Document your calculations: Document your calculations so that others can understand how they work.
- Optimize performance: Optimize the performance of your calculations by using efficient formulas and minimizing the amount of data processed.
6.1. Avoiding Common Mistakes
Avoid these common mistakes when working with aggregate and non-aggregate calculations:
- Using the wrong aggregation function: Using the wrong aggregation function can lead to inaccurate results.
- Mixing aggregate and non-aggregate fields in the same calculation: This can lead to unexpected results.
- Not considering the level of detail: Not considering the level of detail can lead to inaccurate or misleading insights.
- Not testing your calculations: Not testing your calculations can lead to errors.
6.2. Improving Performance
To improve the performance of your calculations, consider the following tips:
- Use efficient formulas: Use efficient formulas that minimize the amount of data processed.
- Filter your data: Filter your data to reduce the amount of data processed.
- Use extracts: Use extracts to improve performance.
- Optimize your data source: Optimize your data source to improve performance.
- Use indexes: Use indexes to improve performance.
7. Advanced Techniques: Combining Aggregate and Non-Aggregate Calculations
In some cases, you may need to combine aggregate and non-aggregate calculations to achieve your analytical goals. This can involve using LOD expressions, table calculations, or custom SQL queries.
7.1. Using LOD Expressions to Combine Aggregation Levels
LOD expressions allow you to perform calculations at different levels of granularity than the view’s current level, making them ideal for combining aggregate and non-aggregate calculations.
For example, you might want to calculate the sales for each customer and then compare each customer’s sales to the average sales for their region. This would require combining a non-aggregate calculation (customer sales) with an aggregate calculation (regional average sales).
7.2. Table Calculations
Table calculations are another way to combine aggregate and non-aggregate calculations. Table calculations operate on the data in the view, allowing you to perform calculations across rows, columns, or partitions.
For example, you might want to calculate the running total of sales for each month. This would require combining a non-aggregate calculation (monthly sales) with a table calculation (running total).
7.3. Custom SQL Queries
In some cases, you may need to use custom SQL queries to combine aggregate and non-aggregate calculations. This allows you to perform complex calculations that are not possible using Tableau’s built-in functions.
For example, you might want to calculate the correlation between sales and advertising spend. This would require using a custom SQL query to calculate the correlation coefficient.
8. Case Studies: Real-World Examples
To illustrate the practical applications of aggregate and non-aggregate calculations, let’s examine some real-world case studies:
8.1. Retail: Analyzing Sales Performance
A retail company wants to analyze its sales performance by product category and region. They can use aggregate calculations to calculate the total sales, average sales, and profit margin for each category and region. They can also use non-aggregate calculations to identify the top-performing products and customers in each category and region.
8.2. Healthcare: Evaluating Patient Outcomes
A healthcare provider wants to evaluate patient outcomes by analyzing patient demographics, medical history, and treatment results. They can use aggregate calculations to calculate the average length of stay, readmission rate, and mortality rate for different patient groups. They can also use non-aggregate calculations to identify patients who are at high risk of complications or readmission.
8.3. Finance: Assessing Investment Returns
A financial institution wants to assess investment returns by analyzing investment performance, risk factors, and market conditions. They can use aggregate calculations to calculate the average return on investment, volatility, and Sharpe ratio for different investment portfolios. They can also use non-aggregate calculations to identify investments that are outperforming or underperforming the market.
9. Tableau Resources and Further Learning
To deepen your understanding of aggregate and non-aggregate calculations in Tableau, explore these resources:
- Tableau Help Documentation: The official Tableau help documentation provides comprehensive information on all aspects of Tableau, including aggregate and non-aggregate calculations.
- Tableau Community Forums: The Tableau community forums are a great place to ask questions, share tips, and learn from other Tableau users.
- Tableau Training Videos: Tableau offers a variety of training videos that cover different topics, including aggregate and non-aggregate calculations.
- Tableau Blogs: Many Tableau experts and enthusiasts maintain blogs that offer tips, tricks, and tutorials on using Tableau.
9.1. Online Courses and Tutorials
Consider these online courses and tutorials to enhance your Tableau skills:
- Tableau Desktop Training: Tableau offers official training courses for Tableau Desktop, covering basic and advanced topics.
- Udemy Tableau Courses: Udemy offers a variety of Tableau courses for different skill levels, taught by experienced instructors.
- Coursera Tableau Courses: Coursera offers Tableau courses from leading universities and institutions, providing a structured learning experience.
- LinkedIn Learning Tableau Courses: LinkedIn Learning offers Tableau courses that cover a wide range of topics, from basic to advanced.
9.2. Tableau Community
Engage with the Tableau community to connect with other users, share your work, and learn from experts:
- Tableau Public: Share your visualizations on Tableau Public to showcase your skills and get feedback from the community.
- Tableau User Groups: Join a Tableau user group to connect with other users in your local area.
- Tableau Conference: Attend the annual Tableau Conference to learn from experts, network with other users, and discover new features.
10. Conclusion: Mastering Tableau Calculations
Mastering aggregate and non-aggregate calculations is essential for unlocking the full potential of Tableau and gaining deeper insights from your data. By understanding the differences between these two approaches and following best practices, you can create accurate, meaningful, and insightful visualizations that drive better decision-making.
Remember, the key to success is to understand your data, define your analytical question, and choose the right aggregation method. With practice and experience, you’ll become proficient in using aggregate and non-aggregate calculations to uncover hidden patterns, trends, and relationships in your data.
Are you struggling to compare aggregate and non-aggregate calculations in Tableau? Visit COMPARE.EDU.VN today to find comprehensive comparisons, expert reviews, and user feedback to help you make informed decisions and optimize your data analysis. Let COMPARE.EDU.VN be your trusted resource for all your comparison needs.
Contact Us:
- Address: 333 Comparison Plaza, Choice City, CA 90210, United States
- WhatsApp: +1 (626) 555-9090
- Website: COMPARE.EDU.VN
FAQ: Aggregate and Non-Aggregate Calculations in Tableau
- What is the difference between aggregate and non-aggregate calculations in Tableau?
Aggregate calculations operate on summarized data, while non-aggregate calculations operate on individual data points. - When should I use aggregate calculations?
Use aggregate calculations when you need to analyze data at a high level and compare aggregated values. - When should I use non-aggregate calculations?
Use non-aggregate calculations when you need to analyze data at the most granular level and perform calculations on individual data points. - What are some common aggregation functions in Tableau?
Common aggregation functions include SUM, AVG, MIN, MAX, COUNT, and COUNTD. - What are LOD expressions?
LOD expressions allow you to perform calculations at different levels of granularity than the view’s current level. - How can I improve the performance of my calculations in Tableau?
Use efficient formulas, filter your data, use extracts, and optimize your data source. - What are some common mistakes to avoid when working with aggregate and non-aggregate calculations?
Avoid using the wrong aggregation function, mixing aggregate and non-aggregate fields, not considering the level of detail, and not testing your calculations. - How can I learn more about aggregate and non-aggregate calculations in Tableau?
Explore the Tableau help documentation, community forums, training videos, and blogs. - Can I combine aggregate and non-aggregate calculations in Tableau?
Yes, you can combine aggregate and non-aggregate calculations using LOD expressions, table calculations, or custom SQL queries. - Where can I find comparisons and expert reviews of Tableau features?
Visit compare.edu.vn for comprehensive comparisons, expert reviews, and user feedback to help you make informed decisions and optimize your data analysis.