American student performance in math and science compared to their international peers has been a topic of ongoing discussion and concern. Standardized test scores from various international assessments paint a picture of U.S. students consistently ranking around the middle of the pack, often trailing behind students in other advanced industrial nations. This article delves into the data from key international and national assessments to provide a clearer understanding of where American students stand.
International Assessments Reveal Middling Performance
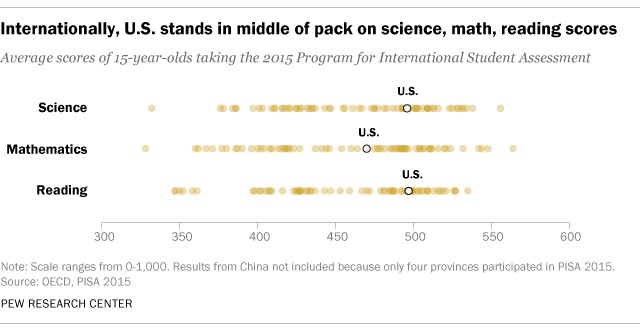
The Programme for International Student Assessment (PISA), a leading international benchmark, evaluates 15-year-olds in reading, math, and science literacy every three years. The 2015 PISA results placed the United States 38th out of 71 participating countries in math and 24th in science. Within the Organization for Economic Cooperation and Development (OECD), which comprises mostly developed nations, the U.S. ranked 30th in math and 19th in science. These results highlight a significant gap between American students and their counterparts in top-performing countries.
The Trends in International Mathematics and Science Study (TIMSS) offers another perspective, assessing fourth and eighth-grade students. While younger American students perform comparatively better, the 2015 TIMSS results still show a number of countries outperforming the U.S. In fourth-grade math, 10 of 48 participating countries had statistically higher average scores, and in science, seven countries outscored the U.S. Similar trends emerged in the eighth-grade results, with several countries demonstrating superior math and science achievement.
National Data Shows Stagnation and Decline
The National Assessment of Educational Progress (NAEP), a national assessment administered by the U.S. Department of Education, provides insights into domestic student performance. The 2015 NAEP revealed concerning trends in math, with average scores for fourth and eighth graders declining for the first time since 1990. While scores for 12th graders remained relatively stable, they showed no significant improvement.
In science, the NAEP results offer a glimmer of hope, with slight improvements observed for fourth and eighth graders between 2009 and 2015. However, 12th-grade science scores remained stagnant. The percentage of students achieving proficiency or higher in science across all grade levels remains relatively low, highlighting ongoing challenges in science education.
Public and Expert Perception Reinforces Concerns
Public opinion aligns with the assessment data, with a 2015 Pew Research Center study finding only 29% of Americans rating the country’s K-12 STEM education as above average or best in the world. Even more concerning, a companion survey of scientists revealed only 16% believed U.S. K-12 STEM education to be above average or best.
Conclusion: Room for Improvement
The convergence of evidence from both international and national assessments, coupled with public and expert opinion, underscores the need for continued focus on improving American education, particularly in STEM fields. While there are pockets of progress, the overall picture indicates significant room for improvement if American students are to compete effectively with their global peers in the 21st century. Addressing this challenge requires a multifaceted approach involving curriculum reform, teacher development, and increased investment in education.