Comparing two Excel spreadsheets doesn’t have to be a daunting task. In fact, there are several effective methods to identify differences and similarities, making it easier than ever to manage your data efficiently. compare.edu.vn offers comprehensive guides and tools to help you master this skill. Learn how to utilize built-in Excel features and third-party software to streamline your comparisons and ensure data accuracy. Discover advanced techniques for data reconciliation and error detection.
1. What is the Best Way to Compare Two Excel Spreadsheets?
The best way to compare two Excel spreadsheets is by using a combination of Excel’s built-in features like conditional formatting, the VLOOKUP function, and dedicated comparison tools. This combination allows for both visual identification of differences and precise data matching.
Excel offers multiple avenues for comparing spreadsheets. Depending on the depth of analysis needed, you can leverage conditional formatting for quick visual cues or delve deeper with functions like VLOOKUP and MATCH to identify specific discrepancies. Third-party tools provide even more robust options for large datasets and complex comparisons.
1.1 Using Conditional Formatting for Visual Comparison
Conditional formatting is a quick and easy way to highlight differences between two spreadsheets visually. It allows you to set rules that automatically format cells based on their values.
1.1.1 How to Use Conditional Formatting:
- Open both Excel spreadsheets.
- Select the data range you want to compare in the first spreadsheet.
- Go to the Home tab, click on Conditional Formatting, then select New Rule.
- Choose “Use a formula to determine which cells to format.”
- Enter a formula that compares the values in the selected range to the corresponding cells in the second spreadsheet. For example, if you’re comparing cells A1:A10 in both spreadsheets, the formula might be
=A1<>Sheet2!A1. - Click on Format to choose the formatting style (e.g., cell fill color) to highlight the differences.
- Click OK to apply the rule.
1.1.2 Advantages of Conditional Formatting:
- Visual Clarity: Quickly identifies differences with color-coded highlights.
- Ease of Use: Simple setup and application, even for beginners.
- Dynamic Updates: Changes are automatically reflected as data is modified.
1.1.3 Limitations of Conditional Formatting:
- Scalability: Can be cumbersome for very large datasets.
- Complexity: Not suitable for complex comparisons requiring detailed analysis.
- Accuracy: Relies on exact matches and may miss subtle variations.
1.2 Employing the VLOOKUP Function for Data Matching
The VLOOKUP function is useful for finding and matching data between two spreadsheets based on a common identifier.
1.2.1 How to Use VLOOKUP:
- Identify a common column between the two spreadsheets (e.g., product ID, employee ID).
- In the spreadsheet where you want to retrieve data, enter the
VLOOKUPformula. For example,=VLOOKUP(A2,Sheet2!A:B,2,FALSE)where A2 is the lookup value,Sheet2!A:Bis the table array,2is the column index number, andFALSEensures an exact match. - Drag the formula down to apply it to all relevant rows.
- Check for
#N/Aerrors, which indicate that the lookup value was not found in the second spreadsheet.
1.2.2 Advantages of VLOOKUP:
- Precise Matching: Ensures data accuracy by finding exact matches.
- Data Retrieval: Efficiently pulls related information from one spreadsheet to another.
- Error Detection: Highlights missing or mismatched data with
#N/Aerrors.
1.2.3 Limitations of VLOOKUP:
- Complexity: Requires a solid understanding of Excel functions.
- Data Structure: Works best when data is well-organized and consistent.
- Performance: Can be slow with very large datasets.
1.3 Utilizing Dedicated Comparison Tools
Specialized comparison tools offer advanced features and greater efficiency for comparing Excel spreadsheets. These tools often provide detailed reports and streamlined workflows.
1.3.1 Examples of Comparison Tools:
- Microsoft Spreadsheet Compare: Part of Office Professional Plus, it generates reports on differences and problems.
- Beyond Compare: A powerful tool for comparing files and folders, including Excel spreadsheets.
- Araxis Merge: Offers visual comparison and merging of text and spreadsheet files.
1.3.2 Advantages of Comparison Tools:
- Detailed Reporting: Provides comprehensive reports on all differences, including formulas and formatting.
- Efficiency: Streamlines the comparison process, saving time and effort.
- Accuracy: Minimizes errors by automating the comparison process.
1.3.3 Limitations of Comparison Tools:
- Cost: Many advanced tools require a paid license.
- Learning Curve: May take time to learn how to use all the features effectively.
- Compatibility: Ensure the tool is compatible with your version of Excel and operating system.
2. What are the Key Features to Look for in Excel Comparison Software?
Key features to look for in Excel comparison software include side-by-side comparison, detailed reporting, the ability to ignore insignificant differences, formula and formatting comparison, and integration with Excel.
Selecting the right Excel comparison software can significantly enhance your productivity and accuracy. Prioritize tools that offer robust feature sets tailored to your specific comparison needs.
2.1 Side-by-Side Comparison
Side-by-side comparison allows you to view two spreadsheets simultaneously, making it easier to spot differences visually.
2.1.1 Importance of Side-by-Side View:
- Visual Clarity: Simplifies the process of identifying discrepancies.
- Contextual Analysis: Allows you to compare data in its original context.
- Efficiency: Reduces the need to switch between windows, saving time.
2.1.2 How it Works:
The software displays both spreadsheets next to each other, highlighting differences in real-time. Some tools also offer synchronized scrolling, ensuring that corresponding rows are always visible.
2.2 Detailed Reporting
Detailed reporting provides a comprehensive overview of all differences, including cell values, formulas, and formatting.
2.2.1 Benefits of Detailed Reports:
- Comprehensive Analysis: Captures all types of changes, ensuring nothing is missed.
- Audit Trail: Provides a record of all modifications, useful for tracking changes over time.
- Improved Accuracy: Reduces the risk of overlooking important differences.
2.2.2 Key Elements of a Detailed Report:
- Cell Value Changes: Identifies cells where the values have been modified.
- Formula Differences: Highlights changes in formulas, including additions, deletions, and modifications.
- Formatting Changes: Detects differences in cell formatting, such as font, color, and alignment.
2.3 Ability to Ignore Insignificant Differences
The ability to ignore insignificant differences, such as whitespace or case variations, helps focus on meaningful changes.
2.3.1 Why Ignoring Minor Differences Matters:
- Reduced Clutter: Filters out irrelevant changes, making it easier to focus on important differences.
- Improved Efficiency: Saves time by avoiding unnecessary analysis of minor variations.
- Customization: Allows you to define what constitutes an insignificant difference.
2.3.2 Examples of Ignorable Differences:
- Whitespace: Differences in the number of spaces or tabs.
- Case Sensitivity: Variations in uppercase and lowercase letters.
- Rounding Errors: Minor discrepancies due to rounding.
2.4 Formula and Formatting Comparison
Formula and formatting comparison ensures that not only data values but also the underlying calculations and visual presentations are consistent.
2.4.1 Importance of Formula Comparison:
- Data Integrity: Ensures that calculations are accurate and consistent.
- Error Detection: Identifies errors in formulas that could lead to incorrect results.
- Transparency: Provides insight into how data is being processed.
2.4.2 Importance of Formatting Comparison:
- Consistency: Maintains a uniform appearance across spreadsheets.
- Readability: Ensures that data is presented in a clear and understandable format.
- Professionalism: Enhances the overall quality and credibility of your work.
2.5 Integration with Excel
Seamless integration with Excel allows you to launch the comparison tool directly from Excel and easily import and export data.
2.5.1 Advantages of Excel Integration:
- Convenience: Streamlines the comparison process by eliminating the need to switch between applications.
- Efficiency: Reduces the time and effort required to import and export data.
- Usability: Makes the comparison tool more accessible and user-friendly.
3. How Does Conditional Formatting Help in Comparing Excel Sheets?
Conditional formatting helps in comparing Excel sheets by visually highlighting differences based on predefined rules, making it easier to spot discrepancies and patterns.
Conditional formatting offers a dynamic way to pinpoint inconsistencies and trends within your data, enhancing your ability to analyze and interpret information effectively.
3.1 Highlighting Duplicate Values
Conditional formatting can highlight duplicate values within a single spreadsheet or across multiple spreadsheets.
3.1.1 Steps to Highlight Duplicates:
- Select the range of cells you want to check for duplicates.
- Go to the Home tab, click on Conditional Formatting, then select Highlight Cells Rules, and choose Duplicate Values.
- Choose the formatting style (e.g., cell fill color) to highlight the duplicates.
- Click OK to apply the rule.
3.1.2 Benefits of Highlighting Duplicates:
- Data Cleansing: Helps identify and remove redundant entries.
- Error Detection: Spots accidental duplicates that could lead to incorrect analysis.
- Data Validation: Ensures data integrity by preventing duplicate entries.
3.2 Identifying Unique Values
Conversely, conditional formatting can also identify unique values that appear only once in a dataset.
3.2.1 Steps to Identify Unique Values:
- Select the range of cells you want to check for unique values.
- Go to the Home tab, click on Conditional Formatting, then select Highlight Cells Rules, and choose Duplicate Values.
- In the dialog box, change the selection from Duplicate to Unique.
- Choose the formatting style to highlight the unique values.
- Click OK to apply the rule.
3.2.2 Benefits of Identifying Unique Values:
- Data Analysis: Helps identify unusual or rare occurrences.
- Pattern Recognition: Spots unique trends or anomalies in the data.
- Data Validation: Ensures that certain values are unique and not repeated.
3.3 Comparing Values Across Sheets
Conditional formatting can compare values across multiple sheets by using formulas to determine which cells to format.
3.3.1 Steps to Compare Values Across Sheets:
- Select the data range in the first sheet that you want to compare.
- Go to the Home tab, click on Conditional Formatting, then select New Rule.
- Choose “Use a formula to determine which cells to format.”
- Enter a formula that compares the values in the selected range to the corresponding cells in the second sheet. For example,
=A1<>Sheet2!A1. - Click on Format to choose the formatting style to highlight the differences.
- Click OK to apply the rule.
3.3.2 Benefits of Comparing Values Across Sheets:
- Data Reconciliation: Ensures that data is consistent across multiple sources.
- Error Detection: Spots discrepancies that could indicate data entry errors or inconsistencies.
- Data Validation: Validates that data is being transferred correctly between sheets.
3.4 Highlighting Top or Bottom Values
Conditional formatting can highlight the top or bottom values in a dataset, making it easier to identify outliers and trends.
3.4.1 Steps to Highlight Top or Bottom Values:
- Select the range of cells you want to analyze.
- Go to the Home tab, click on Conditional Formatting, then select Top/Bottom Rules.
- Choose either Top 10 Items or Bottom 10 Items, or select Top 10% or Bottom 10%.
- Adjust the number or percentage as needed.
- Choose the formatting style to highlight the top or bottom values.
- Click OK to apply the rule.
3.4.2 Benefits of Highlighting Top or Bottom Values:
- Performance Analysis: Identifies top-performing or underperforming items.
- Risk Management: Spots outliers that could indicate potential risks or issues.
- Trend Analysis: Highlights trends by identifying extreme values in the dataset.
3.5 Using Data Bars, Color Scales, and Icon Sets
Conditional formatting offers data bars, color scales, and icon sets to visually represent data values, making it easier to understand distributions and patterns.
3.5.1 Data Bars:
- Purpose: Display horizontal bars within cells to represent the relative size of values.
- Application: Select the data range, go to Conditional Formatting, choose Data Bars, and select a style.
3.5.2 Color Scales:
- Purpose: Apply a gradient of colors to cells based on their values, with higher values represented by one color and lower values by another.
- Application: Select the data range, go to Conditional Formatting, choose Color Scales, and select a color scale.
3.5.3 Icon Sets:
- Purpose: Display icons in cells to represent the relative size or status of values.
- Application: Select the data range, go to Conditional Formatting, choose Icon Sets, and select an icon set.
4. What Are Some Advanced Techniques for Comparing Excel Spreadsheets?
Advanced techniques for comparing Excel spreadsheets include using Power Query, VBA macros, array formulas, and specialized Excel add-ins for complex comparisons.
Mastering these techniques allows for sophisticated analysis and automation of your comparison tasks, saving time and improving accuracy in handling large and complex datasets.
4.1 Using Power Query for Data Transformation and Comparison
Power Query is a powerful data transformation and preparation tool that can be used to compare and merge data from multiple Excel spreadsheets.
4.1.1 Steps to Use Power Query:
- Import data from both Excel spreadsheets into Power Query.
- Transform the data as needed (e.g., rename columns, remove duplicates).
- Merge the queries based on a common column.
- Expand the merged columns to view the data side-by-side.
- Filter the results to identify differences or matches.
4.1.2 Benefits of Using Power Query:
- Data Integration: Combines data from multiple sources into a single view.
- Data Transformation: Cleans and prepares data for analysis.
- Automation: Automates the comparison process, saving time and effort.
4.2 Automating Comparisons with VBA Macros
VBA macros can automate complex comparison tasks, such as identifying differences, highlighting changes, and generating reports.
4.2.1 Steps to Create a VBA Macro:
- Open the VBA editor (Alt + F11).
- Insert a new module (Insert > Module).
- Write the VBA code to compare the spreadsheets.
- Run the macro to perform the comparison.
4.2.2 Example VBA Code:
Sub CompareSheets()
    Dim ws1 As Worksheet, ws2 As Worksheet
    Dim i As Long, lastRow As Long

    Set ws1 = ThisWorkbook.Sheets("Sheet1")
    Set ws2 = ThisWorkbook.Sheets("Sheet2")

    lastRow = ws1.Cells(Rows.Count, "A").End(xlUp).Row

    For i = 1 To lastRow
        If ws1.Cells(i, 1).Value <> ws2.Cells(i, 1).Value Then
            ws1.Cells(i, 1).Interior.Color = RGB(255, 0, 0) 'Red
            ws2.Cells(i, 1).Interior.Color = RGB(255, 0, 0) 'Red
        End If
    Next i

    MsgBox "Comparison complete!"
End Sub
4.2.3 Benefits of Using VBA Macros:
- Automation: Automates repetitive tasks, saving time and effort.
- Customization: Tailors the comparison process to your specific needs.
- Flexibility: Handles complex comparisons that are difficult to perform manually.
4.3 Using Array Formulas for Advanced Comparisons
Array formulas can perform complex comparisons by processing multiple values simultaneously.
4.3.1 Example Array Formula:
To compare two ranges and return an array of TRUE/FALSE values indicating whether the corresponding cells are equal, you can use the following array formula:
=A1:A10=B1:B10
Enter this formula in a range of cells (e.g., C1:C10) and press Ctrl + Shift + Enter to make it an array formula.
4.3.2 Benefits of Using Array Formulas:
- Complex Calculations: Performs advanced calculations on multiple values simultaneously.
- Data Analysis: Analyzes data in ways that are not possible with standard formulas.
- Flexibility: Handles complex comparison scenarios.
4.4 Leveraging Specialized Excel Add-ins
Specialized Excel add-ins provide advanced comparison features and tools that are not available in standard Excel.
4.4.1 Examples of Add-ins:
- Ablebits Compare Two Excel Sheets: Offers a range of comparison tools, including side-by-side comparison and detailed reporting.
- Spreadsheet Compare: Part of Microsoft Office Professional Plus, it generates reports on differences and problems.
4.4.2 Benefits of Using Add-ins:
- Advanced Features: Provides advanced comparison features that are not available in standard Excel.
- Efficiency: Streamlines the comparison process, saving time and effort.
- Usability: Makes complex comparisons easier to perform.
5. How Can I Compare Data Between Two Excel Sheets if They Are Not Identical in Structure?
To compare data between two Excel sheets that are not identical in structure, use a combination of VLOOKUP, INDEX, MATCH, and Power Query to align and compare the data.
When your spreadsheets have different layouts, these techniques allow you to normalize the data before comparing, ensuring accurate and meaningful results.
5.1 Using VLOOKUP to Match Data
VLOOKUP can be used to match data between two sheets based on a common identifier, even if the sheets have different structures.
5.1.1 Steps to Use VLOOKUP:
- Identify a common column between the two sheets.
- In the sheet where you want to retrieve data, enter the
VLOOKUPformula. For example,=VLOOKUP(A2,Sheet2!A:B,2,FALSE)where A2 is the lookup value,Sheet2!A:Bis the table array,2is the column index number, andFALSEensures an exact match. - Drag the formula down to apply it to all relevant rows.
- Check for
#N/Aerrors, which indicate that the lookup value was not found in the second sheet.
5.2 Using INDEX and MATCH for Flexible Lookups
INDEX and MATCH provide a more flexible alternative to VLOOKUP, allowing you to perform lookups in both directions and handle more complex scenarios.
5.2.1 Steps to Use INDEX and MATCH:
- Use the
MATCHfunction to find the row number of the lookup value in the lookup column. For example,=MATCH(A2,Sheet2!A:A,0). - Use the
INDEXfunction to retrieve the value from the desired column in the second sheet. For example,=INDEX(Sheet2!B:B,MATCH(A2,Sheet2!A:A,0)).
5.3 Normalizing Data with Power Query
Power Query can be used to normalize data from multiple sheets, even if they have different structures, by transforming and reshaping the data.
5.3.1 Steps to Use Power Query:
- Import data from both sheets into Power Query.
- Transform the data to match the structure of the other sheet (e.g., rename columns, reorder columns, remove unnecessary columns).
- Merge the queries based on a common column.
- Expand the merged columns to view the data side-by-side.
5.4 Identifying Missing Data and Discrepancies
After aligning the data, you can use conditional formatting or formulas to identify missing data and discrepancies between the two sheets.
5.4.1 Steps to Identify Missing Data:
- Use the
ISNAfunction to check for#N/Aerrors in theVLOOKUPorINDEX/MATCHformulas. For example,=ISNA(VLOOKUP(A2,Sheet2!A:B,2,FALSE)). - Use conditional formatting to highlight the cells where the
ISNAfunction returns TRUE.
5.4.2 Steps to Identify Discrepancies:
- Create a new column that compares the values in the two sheets. For example,
=IF(A2=Sheet2!B2,"Match","Mismatch"). - Use conditional formatting to highlight the cells where the values do not match.
6. What is the Role of Microsoft Spreadsheet Compare in Excel Data Comparison?
Microsoft Spreadsheet Compare plays a significant role in Excel data comparison by providing a detailed report of the differences between two Excel workbooks, including formulas, values, and formatting.
This tool is essential for ensuring data integrity, auditing changes, and understanding the evolution of your spreadsheets, making it an indispensable asset for data management professionals.
6.1 Identifying Differences in Cell Values
Microsoft Spreadsheet Compare identifies and highlights differences in cell values between two versions of an Excel workbook.
6.1.1 How it Works:
The tool compares each cell in the two workbooks and flags any differences in their values, making it easy to spot changes and inconsistencies.
6.1.2 Benefits:
- Accuracy: Ensures that you are aware of all changes in cell values.
- Efficiency: Saves time by automating the comparison process.
- Clarity: Provides a clear and concise report of all value differences.
6.2 Detecting Changes in Formulas
Spreadsheet Compare detects changes in formulas, including additions, deletions, and modifications.
6.2.1 How it Works:
The tool analyzes the formulas in each cell and flags any differences in their structure or references.
6.2.2 Benefits:
- Data Integrity: Ensures that calculations are accurate and consistent.
- Error Detection: Identifies errors in formulas that could lead to incorrect results.
- Transparency: Provides insight into how data is being processed.
6.3 Comparing Formatting and Styles
Spreadsheet Compare compares formatting and styles between two Excel workbooks, including font, color, alignment, and number formats.
6.3.1 How it Works:
The tool analyzes the formatting properties of each cell and flags any differences in their appearance.
6.3.2 Benefits:
- Consistency: Maintains a uniform appearance across workbooks.
- Readability: Ensures that data is presented in a clear and understandable format.
- Professionalism: Enhances the overall quality and credibility of your work.
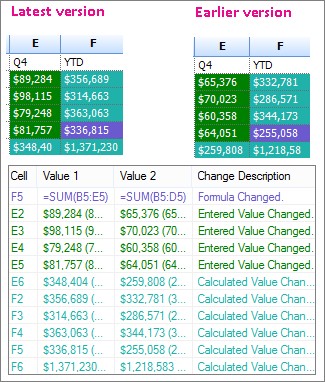
6.4 Generating Detailed Comparison Reports
Spreadsheet Compare generates detailed reports that summarize all the differences between two Excel workbooks, including cell values, formulas, and formatting.
6.4.1 Key Elements of a Detailed Report:
- Summary of Changes: Provides an overview of the number and types of changes detected.
- Detailed List of Differences: Lists each difference individually, with details about the cell, the old value, and the new value.
- Visual Highlighting: Highlights the differences in the workbooks, making it easy to spot them visually.
6.4.2 Benefits of Detailed Reports:
- Comprehensive Analysis: Captures all types of changes, ensuring nothing is missed.
- Audit Trail: Provides a record of all modifications, useful for tracking changes over time.
- Improved Accuracy: Reduces the risk of overlooking important differences.
6.5 Integration with Microsoft Office
Spreadsheet Compare integrates seamlessly with Microsoft Office, allowing you to launch the tool directly from Excel and easily compare workbooks.
6.5.1 Benefits of Office Integration:
- Convenience: Streamlines the comparison process by eliminating the need to switch between applications.
- Efficiency: Reduces the time and effort required to import and export data.
- Usability: Makes the comparison tool more accessible and user-friendly.
7. What are the Common Mistakes to Avoid When Comparing Excel Files?
Common mistakes to avoid when comparing Excel files include not backing up files, ignoring formatting differences, failing to check formulas, and overlooking hidden rows or columns.
Avoiding these pitfalls ensures that your comparisons are thorough and accurate, leading to better data management and decision-making.
7.1 Not Backing Up Your Files Before Comparison
Failing to back up your files before comparison can lead to data loss if something goes wrong during the comparison process.
7.1.1 Why Backups are Important:
- Data Protection: Prevents data loss in case of errors or accidental changes.
- Version Control: Allows you to revert to a previous version if needed.
- Peace of Mind: Provides reassurance that your data is safe and recoverable.
7.1.2 Best Practices for Backups:
- Create a copy of each file before starting the comparison process.
- Store the backups in a safe and separate location.
- Label the backups clearly with the date and time of creation.
7.2 Ignoring Formatting Differences
Ignoring formatting differences can lead to missed discrepancies in the data, as formatting can sometimes indicate important information.
7.2.1 Why Formatting Matters:
- Visual Cues: Formatting can provide visual cues about the type or status of data.
- Data Integrity: Formatting can indicate errors or inconsistencies in the data.
- Readability: Formatting can make data easier to read and understand.
7.2.2 How to Check Formatting:
- Use Spreadsheet Compare to identify formatting differences.
- Manually inspect the formatting of each cell.
- Use conditional formatting to highlight formatting differences.
7.3 Failing to Check Formulas
Failing to check formulas can lead to incorrect results, as formulas can sometimes contain errors or inconsistencies.
7.3.1 Why Formulas are Important:
- Data Integrity: Ensures that calculations are accurate and consistent.
- Error Detection: Identifies errors in formulas that could lead to incorrect results.
- Transparency: Provides insight into how data is being processed.
7.3.2 How to Check Formulas:
- Use Spreadsheet Compare to identify formula differences.
- Manually inspect the formulas in each cell.
- Use the Evaluate Formula tool to step through the calculation process.
7.4 Overlooking Hidden Rows or Columns
Overlooking hidden rows or columns can lead to missed data, as hidden data is not visible in the worksheet.
7.4.1 Why Hidden Data Matters:
- Completeness: Ensures that all data is included in the comparison.
- Accuracy: Prevents errors that could result from missing data.
- Transparency: Provides a complete view of the data.
7.4.2 How to Unhide Rows and Columns:
- Select the rows or columns adjacent to the hidden rows or columns.
- Right-click on the selection and choose Unhide.
7.5 Not Understanding Data Types
Not understanding data types can lead to incorrect comparisons, as different data types may be treated differently by Excel.
7.5.1 Common Data Types in Excel:
- Numbers: Numeric values.
- Text: Alphanumeric characters.
- Dates: Date and time values.
- Boolean: TRUE/FALSE values.
7.5.2 How to Check Data Types:
- Use the TYPE function to determine the data type of a cell. For example,
=TYPE(A1). - Check the formatting of the cell to see if it is formatted as a specific data type.
8. How to Handle Large Excel Files When Comparing Data?
To handle large Excel files when comparing data, use techniques such as splitting files, using Power Query, employing VBA, and leveraging specialized software designed for large datasets.
These strategies enable you to overcome performance limitations and efficiently compare data, ensuring accuracy and saving time.
8.1 Splitting Large Files into Smaller Segments
Splitting large files into smaller segments can improve performance and make it easier to compare data.
8.1.1 How to Split Files:
- Open the large Excel file.
- Sort the data by a relevant column.
- Create new Excel files for each segment of the data.
- Copy and paste the data into the new files.
8.1.2 Benefits of Splitting Files:
- Improved Performance: Reduces the amount of data that Excel has to process at one time.
- Easier Comparison: Makes it easier to compare the data in smaller segments.
- Reduced Risk of Errors: Reduces the risk of errors by breaking the data into manageable chunks.
8.2 Using Power Query for Efficient Data Handling
Power Query can handle large datasets efficiently by loading only the necessary data and performing transformations in memory.
8.2.1 How to Use Power Query:
- Import data from the large Excel files into Power Query.
- Transform the data as needed (e.g., filter, sort, merge).
- Load the transformed data into Excel.
8.2.2 Benefits of Using Power Query:
- Efficient Data Handling: Loads only the necessary data, reducing memory usage.
- Data Transformation: Cleans and prepares data for analysis.
- Automation: Automates the comparison process.
8.3 Employing VBA for Automated Comparison
VBA can be used to automate the comparison of large Excel files, performing the comparison in the background and generating a report of the differences.
8.3.1 Steps to Use VBA:
- Open the VBA editor (Alt + F11).
- Insert a new module (Insert > Module).
- Write the VBA code to compare the files.
- Run the macro to perform the comparison.
8.3.2 Benefits of Using VBA:
- Automation: Automates the comparison process.
- Customization: Tailors the comparison to your specific needs.
- Background Processing: Performs the comparison in the background, allowing you to continue working in Excel.
8.4 Leveraging Specialized Software for Large Datasets
Specialized software designed for large datasets can provide more efficient and powerful comparison tools than Excel.
8.4.1 Examples of Specialized Software:
- Beyond Compare: A powerful tool for comparing files and folders, including Excel files.
- Araxis Merge: Offers visual comparison and merging of text and spreadsheet files.
8.4.2 Benefits of Using Specialized Software:
- Improved Performance: Handles large datasets more efficiently than Excel.
- Advanced Features: Provides advanced comparison features that are not available in Excel.
- Scalability: Scales to handle even the largest datasets.
9. How to Identify and Merge Differences Between Two Excel Files?
To identify and merge differences between two Excel files, use Microsoft Spreadsheet Compare or similar tools for change detection and Excel’s features for manual or semi-automated merging.
This approach allows you to consolidate data effectively, ensuring that your final spreadsheet contains the most up-to-date and accurate information.
9.1 Using Microsoft Spreadsheet Compare for Change Detection
Microsoft Spreadsheet Compare can identify differences between two Excel files, including cell values, formulas, and formatting.
9.1.1 How to Use Spreadsheet Compare:
- Open Spreadsheet Compare.
- Select the two Excel files you want to compare.
- Run the comparison.
- Review the report of differences.
9.1.2 Benefits of Using Spreadsheet Compare:
- Comprehensive Analysis: Identifies all types of changes, ensuring nothing is missed.
- Audit Trail: Provides a record of all modifications.
- Improved Accuracy: Reduces the risk of overlooking important differences.
9.2 Manually Merging Data in Excel
You can manually merge data in Excel by copying and pasting data from one file to another, using formulas to update values, and using conditional formatting to highlight differences.
9.2.1 Steps to Manually Merge Data:
- Open both Excel files.
- Identify the differences between the files.
- Copy and paste the data from one file to the other.
- Use formulas to update values as needed.
- Use conditional formatting to highlight the differences.
9.2.2 Benefits of Manually Merging Data:
- Control: You have complete control over the merging process.
- Flexibility: You can handle complex merging scenarios.
- Cost-Effective: It does not require any additional software.
9.3 Using Formulas for Semi-Automated Merging
Formulas such as IF, VLOOKUP, and INDEX/MATCH can be used to semi-automate the merging process by updating values based on certain conditions.
9.3.1 Example Formulas:
- IF:
=IF(A2<>Sheet2!A2,Sheet2!A2,A2)(updates the value in A2 if it is different from the value in Sheet2!A2). - VLOOKUP:
=VLOOKUP(A2,Sheet2!A:B,2,FALSE)(retrieves the value from Sheet2 based on a common identifier). - INDEX/MATCH:
=INDEX(Sheet2!B:B,MATCH(A2,Sheet2!A:A,0))(provides a more flexible alternative to VLOOKUP).