Can You Compare Discrete Data? Absolutely. Comparing discrete data is a fundamental aspect of statistical analysis, allowing us to identify patterns, relationships, and differences between categories. At COMPARE.EDU.VN, we’re dedicated to providing you with the tools and knowledge to make informed decisions based on data comparisons. Through cross-tabulation, proportion analysis, and other techniques, we can uncover valuable insights from discrete datasets.
1. Understanding Discrete Data and Its Importance
Discrete data, unlike continuous data, can only take on specific, separate values. Think of it as data you can count, like the number of students in a class, the colors of cars in a parking lot, or the responses to a survey question with limited options.
-
Definition of Discrete Data: Discrete data represents countable items. It can be numerical (like the number of products sold) or categorical (like types of fruit).
-
Examples of Discrete Data:
- Number of cars passing a point on a highway in an hour.
- Number of customer complaints received in a day.
- Types of operating systems used in an office (Windows, macOS, Linux).
-
Why Comparing Discrete Data Matters: Comparing discrete data helps identify trends, make predictions, and understand the distribution of different categories. It’s crucial in fields like market research, healthcare, and social sciences.
2. The Power of Cross-Tabulation
One of the primary methods for comparing discrete data is cross-tabulation, also known as contingency tables. This technique allows us to examine the relationship between two or more categorical variables.
-
What is Cross-Tabulation?: Cross-tabulation involves creating a table to show the frequency distribution of two or more variables. It provides a clear view of how different categories interact.
-
Creating a 2×2 Contingency Table: A basic contingency table is a 2×2 table, perfect for analyzing two binary variables (variables with two categories).
Table 2.1: Example of a Generic 2×2 Cross-Tabulation Table
Variable 1: Category A Variable 1: Category B Total Variable 2: X Number of Observations Number of Observations Total for X Variable 2: Y Number of Observations Number of Observations Total for Y Total Total for Category A Total for Category B Total Observations -
Reading and Interpreting a Cross-Tabulation Table: Each cell in the table represents the number of observations that fall into a specific combination of categories. For example, in a table comparing gender and smoking habits, a cell might show the number of women who smoke.
3. Real-World Examples of Discrete Data Comparison
To illustrate the importance of comparing discrete data, let’s examine some practical scenarios.
-
Example 1: Customer Satisfaction Survey:
- Scenario: A company wants to know if customer satisfaction differs between users of their mobile app and their website.
- Discrete Variables:
- Platform (App, Website)
- Satisfaction Level (Satisfied, Neutral, Dissatisfied)
- Analysis: By creating a cross-tabulation table, the company can compare the proportion of satisfied customers on each platform.
-
Example 2: Healthcare Outcomes:
- Scenario: A hospital wants to determine if there’s a relationship between the type of treatment and patient recovery.
- Discrete Variables:
- Treatment Type (Drug A, Drug B, Placebo)
- Recovery Status (Recovered, Not Recovered)
- Analysis: Using cross-tabulation, the hospital can assess which treatment type is associated with a higher recovery rate.
-
Example 3: Education and Performance:
- Scenario: A school district wants to examine the relationship between attendance and student grades.
- Discrete Variables:
- Attendance (Regular, Irregular)
- Grade Level (A, B, C, D, F)
- Analysis: By comparing the distribution of grades for students with regular and irregular attendance, the district can identify potential correlations.
4. Calculating and Interpreting Proportions and Percentages
When comparing discrete data, it’s often necessary to calculate proportions and percentages to account for differences in group sizes.
- Calculating Row and Column Percentages:
- Row Percentage: Calculated as (Cell Value / Row Total) * 100
- Column Percentage: Calculated as (Cell Value / Column Total) * 100
Table 4.1: Example of Calculating Percentages in a Cross-Tabulation Table
| Group A | Group B | Total | |
|---|---|---|---|
| Category X | 20 | 30 | 50 |
| Category Y | 40 | 10 | 50 |
| Total | 60 | 40 | 100 |
| Column Percentage | 33.33% | 75% |
- Interpreting Percentages: Percentages help standardize the data, making it easier to compare different groups. For instance, if 33.33% of Group A falls into Category X, while 75% of Group B falls into the same category, it suggests a significant difference between the groups.
5. Common Pitfalls to Avoid
When comparing discrete data, it’s important to be aware of potential pitfalls that can lead to incorrect conclusions.
-
Ignoring Sample Size: Always consider the sample size when interpreting results. Small sample sizes can lead to unstable estimates and unreliable conclusions.
-
Confusing Correlation with Causation: Just because two variables are associated doesn’t mean one causes the other. There may be other factors at play.
-
Misinterpreting Percentages: Make sure to calculate and interpret percentages correctly. Using the wrong base (row vs. column) can lead to misleading results.
-
Overlooking Confounding Variables: These are variables that are related to both the independent and dependent variables, potentially distorting the true relationship between them.
6. Advanced Techniques for Discrete Data Analysis
Beyond basic cross-tabulation, several advanced techniques can provide deeper insights into discrete data.
-
Chi-Square Test: This test is used to determine if there is a statistically significant association between two categorical variables.
-
Fisher’s Exact Test: Useful for small sample sizes when the assumptions of the Chi-Square test are not met.
-
Cochran–Mantel–Haenszel Test: Used to control for confounding variables when examining the association between two categorical variables.
-
Odds Ratio: A measure of association between an exposure and an outcome. It represents the odds that an outcome will occur given a particular exposure, compared to the odds of the outcome occurring in the absence of that exposure.
7. Visualizing Discrete Data Comparisons
Visualizations can enhance the understanding of discrete data comparisons, making patterns and trends more apparent.
-
Bar Charts: Ideal for comparing the frequencies of different categories.
-
Stacked Bar Charts: Useful for showing the composition of different groups.
-
Mosaic Plots: Effective for displaying the relationship between two or more categorical variables.
-
Pie Charts: Suitable for showing the proportion of each category in a dataset.
8. Tools and Software for Discrete Data Analysis
Numerous tools and software packages can assist in analyzing and comparing discrete data.
-
SPSS: A powerful statistical software package that offers a wide range of tools for analyzing discrete data, including cross-tabulation, Chi-Square tests, and more.
-
R: A programming language and environment for statistical computing and graphics. R provides numerous packages for analyzing and visualizing discrete data.
-
Excel: While not as specialized as SPSS or R, Excel can be used for basic cross-tabulation and percentage calculations.
-
Python: With libraries like Pandas and Matplotlib, Python is a versatile tool for data analysis and visualization.
9. Case Studies: Successful Discrete Data Comparisons
Let’s look at some case studies where comparing discrete data led to meaningful insights and informed decision-making.
-
Case Study 1: Marketing Campaign Analysis
- Objective: Evaluate the effectiveness of a marketing campaign across different demographics.
- Data:
- Demographic Group (Age, Gender, Location)
- Campaign Response (Clicked Ad, Made Purchase)
- Analysis: By comparing response rates across different demographics, the marketing team identified which segments were most responsive to the campaign.
- Outcome: The company adjusted its marketing strategy to focus on the most responsive demographics, resulting in a 30% increase in conversion rates.
-
Case Study 2: Employee Satisfaction
- Objective: Identify factors affecting employee satisfaction in a company.
- Data:
- Department (Marketing, Sales, Engineering)
- Satisfaction Level (Very Satisfied, Satisfied, Neutral, Dissatisfied, Very Dissatisfied)
- Analysis: Comparing satisfaction levels across departments revealed that employees in the engineering department reported significantly lower satisfaction.
- Outcome: The company conducted further investigation and implemented changes to address the concerns of the engineering department, leading to improved morale and reduced turnover.
10. Practical Tips for Effective Discrete Data Comparison
Here are some practical tips to ensure your discrete data comparisons are effective and accurate.
-
Define Clear Research Questions: Start with clear, specific questions you want to answer. This will guide your analysis and help you focus on the most relevant comparisons.
-
Ensure Data Quality: Clean and validate your data to ensure accuracy. Errors in the data can lead to incorrect conclusions.
-
Choose Appropriate Statistical Tests: Select statistical tests that are appropriate for your data and research questions. Consult with a statistician if needed.
-
Present Results Clearly: Use visualizations and tables to present your results in a clear and understandable manner.
-
Document Your Analysis: Keep a detailed record of your analysis, including the steps you took, the tests you used, and the results you obtained.
11. The Role of COMPARE.EDU.VN in Data-Driven Decisions
At COMPARE.EDU.VN, we understand the importance of making informed decisions based on solid data analysis. Whether you’re comparing educational programs, consumer products, or healthcare options, our platform provides you with the tools and resources you need to conduct thorough and accurate comparisons.
-
Comprehensive Comparison Tools: We offer a range of tools for comparing discrete data, including cross-tabulation, percentage calculations, and statistical tests.
-
Expert Analysis and Insights: Our team of experts provides in-depth analysis and insights to help you interpret your data and make informed decisions.
-
User-Friendly Interface: Our platform is designed to be user-friendly, making it easy for anyone to conduct data comparisons, regardless of their technical expertise.
12. Future Trends in Discrete Data Analysis
The field of data analysis is constantly evolving, with new techniques and technologies emerging all the time. Here are some future trends to watch out for.
-
Machine Learning: Machine learning algorithms are increasingly being used to analyze discrete data and identify patterns that might be missed by traditional statistical methods.
-
Big Data: The increasing availability of big data is creating new opportunities for discrete data analysis. With larger datasets, it’s possible to uncover more subtle relationships and trends.
-
Data Visualization: New visualization techniques are making it easier to explore and understand discrete data. Interactive dashboards and visual analytics tools are becoming increasingly popular.
-
Real-Time Analysis: Real-time data analysis is enabling organizations to make faster and more informed decisions. This is particularly important in fields like marketing and customer service, where timely responses can make a big difference.
13. Ethical Considerations in Discrete Data Comparison
When comparing discrete data, it’s crucial to consider ethical implications to ensure responsible and fair analysis.
-
Data Privacy: Protect the privacy of individuals by anonymizing data and adhering to privacy regulations.
-
Bias Awareness: Be aware of potential biases in data collection and analysis, and take steps to mitigate them.
-
Transparency: Clearly communicate the methods and assumptions used in your analysis to ensure transparency.
-
Fairness: Strive for fairness in your analysis and avoid making discriminatory decisions based on data.
14. Frequently Asked Questions (FAQ)
Here are some frequently asked questions about comparing discrete data.
- What is the difference between discrete and continuous data? Discrete data can only take on specific, separate values, while continuous data can take on any value within a range.
- When should I use cross-tabulation? Use cross-tabulation when you want to examine the relationship between two or more categorical variables.
- How do I calculate row and column percentages? Row Percentage = (Cell Value / Row Total) 100; Column Percentage = (Cell Value / Column Total) 100
- What is the Chi-Square test used for? The Chi-Square test is used to determine if there is a statistically significant association between two categorical variables.
- What are some common pitfalls to avoid when comparing discrete data? Ignoring sample size, confusing correlation with causation, misinterpreting percentages, and overlooking confounding variables.
- What tools can I use to analyze discrete data? SPSS, R, Excel, and Python are all popular tools for discrete data analysis.
- How can visualizations help in discrete data comparison? Visualizations can make patterns and trends more apparent, enhancing understanding.
- What are some ethical considerations in discrete data comparison? Data privacy, bias awareness, transparency, and fairness.
- What is the role of COMPARE.EDU.VN in data-driven decisions? COMPARE.EDU.VN provides comprehensive comparison tools, expert analysis, and a user-friendly interface to help you make informed decisions.
- What are some future trends in discrete data analysis? Machine learning, big data, data visualization, and real-time analysis.
15. Conclusion: Making Informed Decisions with Discrete Data
Comparing discrete data is a powerful tool for uncovering insights and making informed decisions. By understanding the principles and techniques outlined in this guide, you can effectively analyze discrete datasets and draw meaningful conclusions.
Remember, COMPARE.EDU.VN is here to support you in your data analysis journey. Whether you’re a student, a professional, or simply someone who wants to make better decisions, our platform provides you with the resources and expertise you need to succeed.
Ready to start comparing discrete data and making data-driven decisions? Visit compare.edu.vn today and explore our comprehensive suite of comparison tools. Located at 333 Comparison Plaza, Choice City, CA 90210, United States, or reach us via Whatsapp at +1 (626) 555-9090. Let us help you find the comparisons you need to make the best choices for your future.
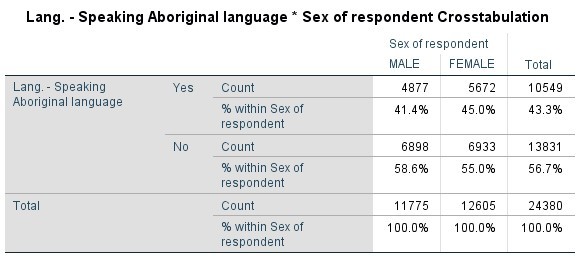 Cross-tabulation example
Image showing column percentages from a cross-tabulation table examining Aboriginal language ability by gender, illustrating the distribution of language skills between men and women.