Line graphs are excellent tools for showcasing trends and changes in data over time, and at COMPARE.EDU.VN, we help you understand how to utilize them effectively for comparisons. Comparing different groups using a line graph is indeed possible and can be very informative if done correctly. By visualizing trends and changes, you gain a clearer understanding of the data, enabling informed decision-making. Learn the best strategies for data visualization.
1. What Is A Line Graph And Why Use It For Comparisons?
A line graph, also known as a line chart, uses lines to connect individual data points, displaying quantitative values over a specific period. Each data point represents a particular value, and the lines show the trend or relationship between these values.
1.1. Key Elements Of A Line Graph
- Axes: Typically, the horizontal (x-axis) represents the independent variable (e.g., time), and the vertical (y-axis) represents the dependent variable (e.g., values).
- Data Points: These are the specific values plotted on the graph.
- Lines: Connect data points, illustrating trends or changes over the period.
- Title and Labels: Provide context, explaining what the graph represents.
1.2. Advantages Of Using Line Graphs For Comparisons
- Trend Identification: Line graphs excel at revealing trends and patterns over time.
- Clarity: Easy to understand changes and fluctuations.
- Multiple Datasets: Effectively display and compare multiple datasets on the same graph.
- Insightful: Offers a comprehensive view of how different groups behave over time.
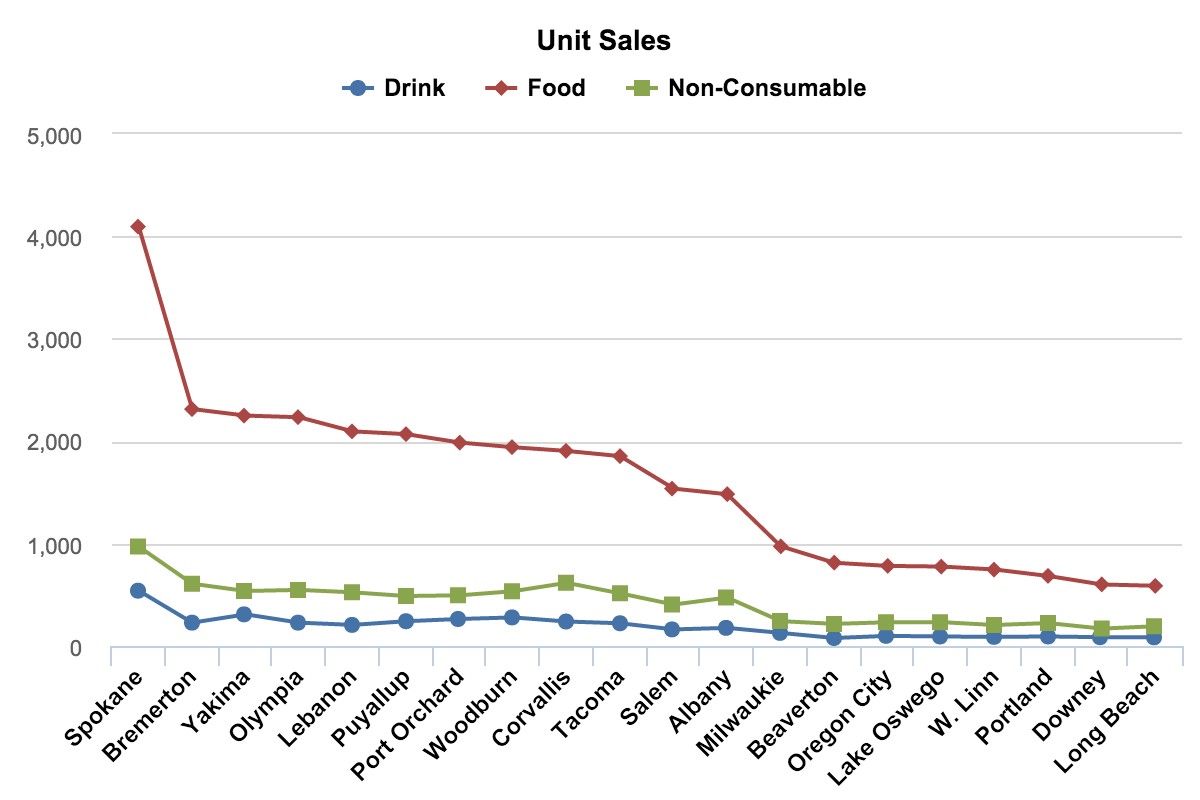 Line chart for effectively compare different groups data visualization
2. When Is A Line Graph Appropriate For Comparing Groups?
Choosing the right visualization method is crucial for effectively communicating data. Line graphs are particularly well-suited for specific comparison scenarios.
2.1. Suitable Scenarios
- Time-Series Data: Ideal for comparing how different groups change over time (e.g., sales trends, temperature variations).
- Continuous Data: Effective when data points are continuous and sequential.
- Multiple Groups: Useful for comparing the performance or trends of several groups simultaneously.
- Trend Emphasis: Best when the primary goal is to highlight trends and patterns rather than precise values.
2.2. Scenarios To Avoid
- Categorical Data: Not suitable for comparing distinct categories without a sequential relationship.
- Few Data Points: Less effective when comparing groups with very few data points.
- Precise Values: Not ideal for needing to compare exact values. Consider a bar chart for detailed comparisons.
- Part-To-Whole Comparisons: Pie charts or stacked bar charts are more appropriate for showing proportions.
3. How To Create An Effective Line Graph For Comparing Groups
Creating an effective line graph involves several steps to ensure clarity and accuracy. Here’s how to do it:
3.1. Data Preparation
- Gather Data: Collect data for each group you want to compare.
- Organize Data: Structure data so each group’s values are aligned with the same time or sequential intervals.
- Clean Data: Check for and correct any errors or inconsistencies.
- Ensure Consistency: Verify that data is measured using the same units and methods across all groups.
3.2. Choosing The Right Tools
Several tools can help you create line graphs, each with its strengths:
- Microsoft Excel: User-friendly for basic line graphs.
- Google Sheets: Accessible and collaborative, ideal for simpler comparisons.
- Tableau: Powerful for creating interactive and complex visualizations.
- Python (with Matplotlib or Seaborn): Flexible for creating custom graphs with advanced analytics.
- R (with ggplot2): Excellent for statistical visualizations and in-depth data exploration.
3.3. Graph Construction
- Set Up Axes:
- X-Axis: Represents time or sequential intervals.
- Y-Axis: Represents the values being compared.
- Plot Data Points:
- Plot data points for each group at the appropriate intervals.
- Ensure accuracy in plotting each value.
- Connect Data Points:
- Use straight lines to connect data points within each group.
- Use distinct colors for each group to avoid confusion.
- Add Labels and Titles:
- Title: Clearly describe what the graph represents.
- Axis Labels: Label both axes with appropriate units.
- Legend: Include a legend identifying each group’s color.
- Customize Appearance:
- Choose clear and contrasting colors for each line.
- Use appropriate line thickness to ensure readability.
- Add gridlines for easier value interpretation.
- Adjust axis scales to best display the data range.
3.4. Example: Comparing Website Traffic
Imagine you want to compare the website traffic of three different marketing campaigns over six months.
- Data Table:
| Month | Campaign A | Campaign B | Campaign C |
|---|---|---|---|
| January | 1200 | 1500 | 1000 |
| February | 1300 | 1600 | 1100 |
| March | 1400 | 1700 | 1200 |
| April | 1500 | 1800 | 1300 |
| May | 1600 | 1900 | 1400 |
| June | 1700 | 2000 | 1500 |
- Graph:
- X-Axis: Months (January to June).
- Y-Axis: Website Traffic.
- Lines:
- Campaign A (Blue).
- Campaign B (Green).
- Campaign C (Red).
- Title: Website Traffic Comparison by Campaign (Jan-June).
- Labels: Clear labels for both axes and a legend identifying each campaign.
4. Best Practices For Enhanced Clarity
To ensure your line graph effectively communicates the intended message, follow these best practices:
4.1. Color Consistency
- Consistent Colors: Use the same color for each group throughout all visualizations.
- Color Blindness: Ensure color choices are accessible to those with color blindness.
4.2. Clear Labeling
- Direct Labels: Label lines directly to avoid needing a legend.
- Concise Labels: Keep labels short and descriptive.
4.3. Appropriate Scaling
- Relevant Range: Scale axes to the relevant data range.
- Avoid Distortion: Prevent misleading interpretations by avoiding truncated axes.
4.4. Line Thickness
- Readable Lines: Ensure lines are thick enough to be easily seen.
- Avoid Clutter: Prevent lines from overlapping excessively.
4.5. Gridlines And Markers
- Subtle Gridlines: Use faint gridlines to assist in reading values.
- Selective Markers: Add markers to highlight key data points without cluttering the graph.
4.6. Annotations
- Key Events: Annotate significant events or outliers that affect trends.
- Contextual Notes: Add brief notes to provide additional context.
5. Interpreting Line Graphs Effectively
Interpreting line graphs requires understanding the data and the visual representation.
5.1. Trend Identification
- Increasing Trends: Upward-sloping lines indicate growth.
- Decreasing Trends: Downward-sloping lines indicate decline.
- Stable Trends: Horizontal lines indicate stability.
5.2. Comparative Analysis
- Overlapping Lines: Indicate similar performance.
- Diverging Lines: Indicate differing performance.
- Cross-Over Points: Indicate where one group’s performance surpasses another.
5.3. Outlier Detection
- Sudden Spikes or Drops: Identify outliers that deviate from the overall trend.
- Possible Causes: Investigate potential reasons behind outliers.
5.4. Understanding Limitations
- Correlation vs. Causation: Remember that correlation does not imply causation.
- Contextual Factors: Consider external factors that might influence the data.
- Data Quality: Be aware of data limitations and potential biases.
6. Advanced Techniques For Line Graph Comparisons
For more sophisticated comparisons, consider these advanced techniques:
6.1. Interactive Line Graphs
- Tooltips: Allow users to hover over data points for specific values.
- Zooming: Enable users to zoom in on specific timeframes.
- Filtering: Allow users to filter which groups are displayed.
6.2. Multi-Line Graphs With Faceting
- Small Multiples: Create a series of smaller line graphs, each displaying a subset of the data.
- Easier Comparison: Facilitate easier comparison by isolating groups.
6.3. Stacked Area Charts
- Total Values: Show how the total value is distributed among different groups over time.
- Trend Analysis: Useful for understanding the contribution of each group to the total.
6.4. Normalized Line Graphs
- Percentage Changes: Display percentage changes rather than absolute values.
- Comparable Scales: Allow for comparing groups with different initial values.
7. Common Pitfalls To Avoid
Even with careful construction, several pitfalls can undermine the effectiveness of line graph comparisons:
7.1. Overcrowding
- Too Many Lines: Avoid plotting too many lines on a single graph, which can lead to confusion.
- Solution: Limit the number of groups or use faceting to create multiple smaller graphs.
7.2. Misleading Scales
- Truncated Axes: Starting the y-axis at a value other than zero can exaggerate trends.
- Inconsistent Intervals: Using inconsistent intervals on the x-axis can distort the perception of time-based trends.
7.3. Poor Color Choices
- Lack of Contrast: Using colors that are too similar can make it difficult to distinguish between groups.
- Overuse of Color: Using too many colors can overwhelm the viewer.
7.4. Inadequate Labeling
- Missing Labels: Failing to label axes, lines, or data points can leave viewers confused.
- Small Font Sizes: Using font sizes that are too small can make labels difficult to read.
7.5. Ignoring Context
- Lack of Background Information: Failing to provide contextual information about the data can lead to misinterpretations.
- Ignoring External Factors: Overlooking external factors that may influence trends can result in incomplete analysis.
8. Real-World Examples Of Effective Line Graph Comparisons
To illustrate the power of line graph comparisons, here are some real-world examples:
8.1. Comparing Sales Performance
- Scenario: A retail company wants to compare the sales performance of different product categories over the past year.
- Line Graph: The x-axis represents months, and the y-axis represents sales revenue. Each product category is represented by a different colored line.
- Insights: The graph reveals which product categories are growing, declining, or remaining stable. It also shows seasonal trends and the impact of marketing campaigns.
8.2. Analyzing Website Traffic
- Scenario: A marketing team wants to compare the website traffic generated by different marketing channels (e.g., organic search, paid advertising, social media) over the past quarter.
- Line Graph: The x-axis represents weeks, and the y-axis represents website visits. Each marketing channel is represented by a different colored line.
- Insights: The graph shows which channels are most effective at driving traffic. It also reveals trends in channel performance and the impact of marketing initiatives.
8.3. Tracking Stock Prices
- Scenario: An investor wants to compare the stock prices of different companies in the same industry over the past five years.
- Line Graph: The x-axis represents years, and the y-axis represents stock prices. Each company is represented by a different colored line.
- Insights: The graph illustrates the relative performance of each company’s stock. It also reveals long-term trends, volatility, and the impact of market events.
8.4. Monitoring Climate Change
- Scenario: Climate scientists want to compare the average global temperatures in different regions over the past century.
- Line Graph: The x-axis represents years, and the y-axis represents temperature in degrees Celsius. Each region is represented by a different colored line.
- Insights: The graph shows how temperatures have changed in different regions over time. It also reveals regional variations in climate change and the overall trend of global warming.
9. The Role Of Compare.Edu.Vn In Data Comparison
At COMPARE.EDU.VN, our mission is to provide you with the tools and knowledge needed to make informed decisions through effective data comparison.
9.1. Comprehensive Comparisons
-
Objective Analysis: We offer detailed and unbiased comparisons across various products, services, and ideas.
-
Feature Comparisons: We provide side-by-side comparisons of key features, specifications, and prices.
9.2. Expert Reviews And User Feedback
-
User Insights: Gain insights from reviews and feedback from real users and industry experts.
-
Informed Decisions: Make well-informed decisions based on collective knowledge.
9.3. Data Visualization Tools
- Interactive Graphs: Explore interactive visualizations that simplify complex data.
- Customized Comparisons: Create personalized comparisons tailored to your needs.
9.4. Resources And Guides
- Informative Articles: Access in-depth articles and guides on data comparison and visualization.
- Best Practices: Learn best practices for presenting and interpreting data.
10. FAQ About Comparing Groups With Line Graphs
1. What is a line graph best used for?
A line graph is best used for displaying trends and changes in data over a continuous period. It is particularly effective for visualizing time-series data, such as sales trends, temperature variations, or stock prices.
2. Can I use a line graph to compare different categories?
Yes, you can use a line graph to compare different categories if they have a sequential or continuous relationship. For example, comparing the sales performance of different product categories over time. However, line graphs are not suitable for comparing distinct categories without a sequential relationship.
3. How many lines should I include in a line graph?
To maintain clarity, it’s best to limit the number of lines to 3-5. Too many lines can make the graph cluttered and difficult to interpret. If you need to compare more groups, consider using multiple graphs or faceting.
4. What should I do if the data ranges for different groups vary widely?
If the data ranges vary widely, consider using a normalized line graph. This involves displaying percentage changes rather than absolute values, allowing you to compare groups with different initial values on a common scale.
5. How can I make my line graph accessible to people with color blindness?
Choose color palettes that are color-blind friendly. Avoid using red and green together, as these colors can be difficult for color-blind individuals to distinguish. Tools like Vischeck can help you test your images for color blindness accessibility.
6. What are some common mistakes to avoid when creating line graphs?
Common mistakes include overcrowding the graph with too many lines, using misleading scales (e.g., truncated axes), poor color choices (e.g., lack of contrast), inadequate labeling, and ignoring contextual information.
7. How do I choose the right intervals for the x-axis?
Choose intervals that are appropriate for the data range and frequency. The intervals should be evenly spaced and clearly labeled. Avoid using inconsistent intervals, as this can distort the perception of time-based trends.
8. Should I always start the y-axis at zero?
Starting the y-axis at zero is generally recommended, as it provides an accurate representation of the data. However, in some cases, it may be appropriate to start the y-axis at a value other than zero if the goal is to highlight small differences in trends. Just be cautious, as this can sometimes exaggerate trends.
9. How can I add more context to my line graph?
Add annotations to highlight significant events or outliers that affect trends. Include brief notes to provide additional context. Also, make sure to provide a clear title and axis labels that explain what the graph represents.
10. What tools can I use to create line graphs?
Several tools are available for creating line graphs, including Microsoft Excel, Google Sheets, Tableau, Python (with Matplotlib or Seaborn), and R (with ggplot2). Choose the tool that best fits your needs and technical skills.
At COMPARE.EDU.VN, we understand the challenges of comparing different options and making informed decisions. That’s why we offer detailed, objective comparisons across various products, services, and ideas. Our resources provide you with the information you need to make the right choice.
Ready to make smarter decisions? Visit COMPARE.EDU.VN today and explore our comprehensive comparisons and expert reviews. With COMPARE.EDU.VN, you’ll have the insights you need to choose with confidence.
Address: 333 Comparison Plaza, Choice City, CA 90210, United States
Whatsapp: +1 (626) 555-9090
Website: compare.edu.vn