Are you wondering “Can I Statistically Compare Quantitative With Qualitative Variables?” Understanding how to analyze different types of data is essential for drawing meaningful conclusions from research. At COMPARE.EDU.VN, we provide comprehensive comparisons and insights to help you make informed decisions. This article explores the methodologies and considerations for comparing quantitative and qualitative variables, offering solutions to overcome analytical challenges and enhance research outcomes. Delve into the nuances of statistical analysis and data interpretation on COMPARE.EDU.VN.
1. Understanding Quantitative and Qualitative Variables
To address the question of statistically comparing quantitative with qualitative variables, it’s crucial to first define and differentiate these two types of data. Quantitative data is numerical and can be measured, while qualitative data is descriptive and expresses qualities or characteristics. Understanding their distinct nature is foundational for appropriate analysis.
1.1 Defining Quantitative Variables
Quantitative variables are those that can be measured numerically, providing a basis for arithmetic operations. These variables answer questions like “how many” or “how much” and can be further categorized into discrete and continuous types.
- Discrete Variables: These can only take on specific, separate values, often integers. Examples include the number of customers, the count of products sold, or the number of errors in a dataset.
- Continuous Variables: These can take on any value within a given range, allowing for fractional or decimal values. Examples include height, weight, temperature, or income.
Quantitative data’s numerical nature allows for statistical analysis such as calculating means, medians, standard deviations, and conducting regression analyses, providing a comprehensive understanding of the data’s central tendencies and variability. Tools like statistical software packages (e.g., SPSS, R, or SAS) and spreadsheet programs (e.g., Microsoft Excel or Google Sheets) are commonly used to analyze quantitative variables.
1.2 Defining Qualitative Variables
Qualitative variables, also known as categorical variables, represent characteristics or attributes that cannot be measured numerically. These variables describe qualities and are typically categorized into nominal and ordinal types.
- Nominal Variables: These are categorical variables that have no inherent order or ranking. Examples include color (e.g., red, blue, green), type of animal (e.g., dog, cat, bird), or marital status (e.g., single, married, divorced).
- Ordinal Variables: These are categorical variables with a natural order or ranking. Examples include education level (e.g., high school, bachelor’s, master’s), customer satisfaction (e.g., very dissatisfied, dissatisfied, neutral, satisfied, very satisfied), or socio-economic status (e.g., low, middle, high).
Qualitative data is often collected through interviews, focus groups, and open-ended survey questions. Analyzing qualitative data involves identifying common themes, patterns, and categories within the data. Techniques like content analysis, thematic analysis, and narrative analysis are used to interpret and understand the data’s meaning.
1.3 Key Differences Summarized
The fundamental difference between quantitative and qualitative variables lies in their nature and how they are measured. Quantitative variables are numerical and measurable, allowing for statistical analysis. In contrast, qualitative variables are descriptive and categorical, requiring interpretive analysis.
| Feature | Quantitative Variables | Qualitative Variables |
|---|---|---|
| Nature | Numerical and measurable | Descriptive and categorical |
| Measurement | Measured using numerical scales | Described using categories or attributes |
| Types | Discrete and continuous | Nominal and ordinal |
| Analysis | Statistical analysis (e.g., mean, standard deviation) | Interpretive analysis (e.g., thematic analysis) |
| Data Collection | Surveys, experiments, numerical records | Interviews, focus groups, open-ended survey questions |
| Example Questions | How many? How much? | Why? How? What? |
Understanding these distinctions is essential when considering whether and how to statistically compare quantitative and qualitative variables, as the methods used must align with the data’s characteristics.
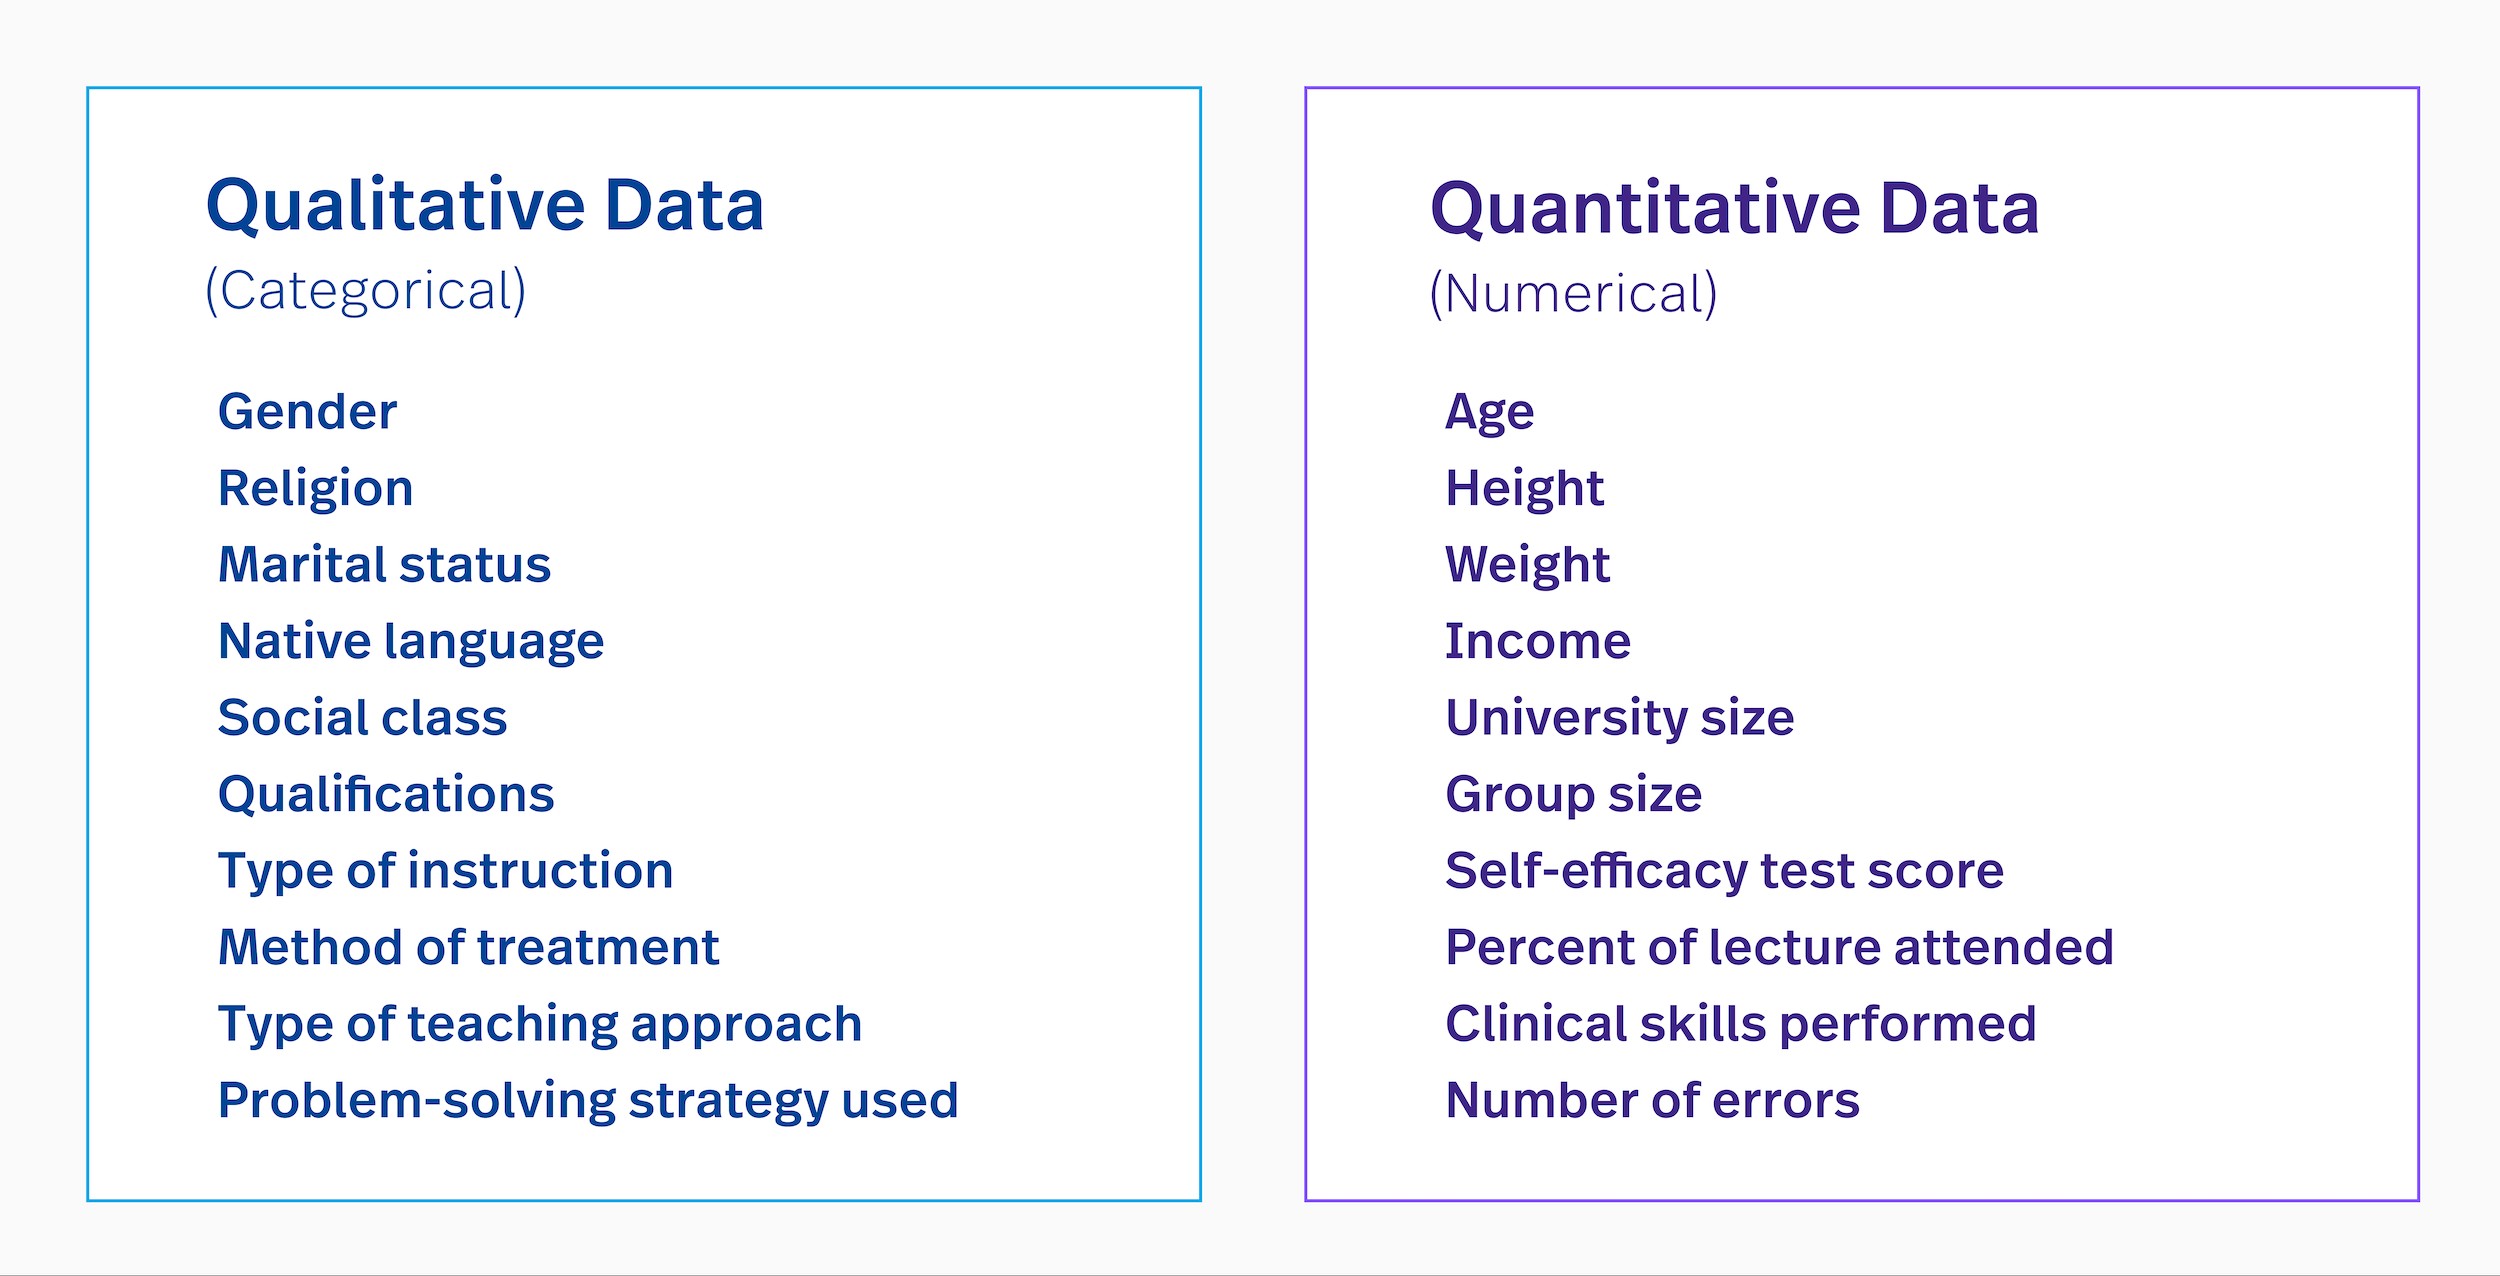 Qualtitative vs quantitative examples
2. The Challenge of Comparing Different Data Types
Statistically comparing quantitative with qualitative variables presents unique challenges due to the inherent differences in their nature and measurement scales. However, several techniques and considerations can facilitate meaningful comparisons.
2.1 Understanding the Inherent Differences
Quantitative and qualitative variables differ fundamentally in their scales of measurement. Quantitative variables are measured on interval or ratio scales, allowing for arithmetic operations and statistical analysis. Qualitative variables, on the other hand, are measured on nominal or ordinal scales, which do not support the same types of mathematical operations.
- Scale of Measurement:
- Nominal: Categories with no inherent order (e.g., colors, types of fruit).
- Ordinal: Categories with a meaningful order (e.g., education levels, satisfaction ratings).
- Interval: Numerical data with equal intervals but no true zero point (e.g., temperature in Celsius).
- Ratio: Numerical data with equal intervals and a true zero point (e.g., height, weight).
Because of these differences, directly comparing means or standard deviations between quantitative and qualitative variables is not appropriate. Statistical methods must be carefully selected to account for these differences.
2.2 Common Pitfalls to Avoid
Several common pitfalls can undermine the validity of comparisons between quantitative and qualitative variables. It’s essential to be aware of these issues to ensure accurate and meaningful analysis.
- Misinterpreting Correlations: Assuming that a relationship between a quantitative variable and a qualitative variable implies causation without further investigation.
- Overgeneralization: Drawing broad conclusions from small or non-representative qualitative datasets.
- Ignoring Context: Failing to consider the context in which qualitative data was collected, leading to misinterpretations.
- Applying Inappropriate Statistical Tests: Using statistical tests designed for quantitative data on qualitative data, which can produce meaningless results.
2.3 Transforming Qualitative Data: Quantification
One approach to statistically compare qualitative with quantitative variables involves transforming qualitative data into a quantitative form through a process called quantification. This allows for the application of statistical methods to the transformed data.
- Coding Qualitative Data: Assigning numerical codes to qualitative categories. For example, assigning 1 to “satisfied,” 2 to “neutral,” and 3 to “dissatisfied” in a customer satisfaction survey.
- Creating Dummy Variables: Converting nominal variables into binary (0 or 1) variables. For example, if you have a “color” variable with categories “red,” “blue,” and “green,” you can create three dummy variables: “is_red,” “is_blue,” and “is_green.”
- Index Creation: Combining multiple qualitative variables into a single quantitative index. For example, creating a “socioeconomic status” index based on education level, income, and occupation.
2.4 Considerations for Accurate Quantification
While quantification can be useful, it’s essential to approach it with caution to maintain the integrity of the data and avoid misleading results.
- Justification: Clearly justify the rationale for quantification and ensure that it aligns with the research questions.
- Transparency: Document the coding and transformation process thoroughly to ensure transparency and replicability.
- Validity: Assess the validity of the quantified data by comparing it to the original qualitative data.
- Sensitivity Analysis: Conduct sensitivity analysis to assess how different coding schemes affect the results.
By carefully considering these challenges and implementing appropriate techniques, it’s possible to derive meaningful insights from comparisons between quantitative and qualitative variables.
3. Statistical Methods for Comparison
When comparing quantitative with qualitative variables, it’s essential to use statistical methods that are appropriate for the nature and measurement scales of the data. Several techniques can be employed to facilitate these comparisons effectively.
3.1 Chi-Square Test
The Chi-Square test is a statistical method used to determine if there is a significant association between two categorical variables. It assesses whether the observed frequency distribution of the data differs from the expected frequency distribution if the variables were independent.
- Application: This test is suitable when you want to examine the relationship between two qualitative variables. For example, you can use the Chi-Square test to determine if there is a relationship between education level (e.g., high school, bachelor’s, master’s) and job satisfaction (e.g., satisfied, neutral, dissatisfied).
- Interpretation: A significant Chi-Square test result indicates that there is a statistically significant association between the two variables. However, it does not imply causation.
Example Scenario:
Suppose a researcher wants to investigate the relationship between gender (male, female) and preference for a particular brand of coffee (Brand A, Brand B). The researcher collects data from a sample of 500 individuals and organizes the data in a contingency table:
| Brand A | Brand B | |
|---|---|---|
| Male | 150 | 100 |
| Female | 120 | 130 |
Using the Chi-Square test, the researcher calculates the Chi-Square statistic and compares it to a critical value from the Chi-Square distribution. If the Chi-Square statistic exceeds the critical value, the researcher can conclude that there is a statistically significant association between gender and coffee brand preference.
3.2 ANOVA (Analysis of Variance)
ANOVA is a statistical method used to compare the means of two or more groups. It assesses whether there are any statistically significant differences between the group means.
- Application: ANOVA is appropriate when you want to compare a quantitative variable across different categories of a qualitative variable. For example, you can use ANOVA to compare the average income of individuals with different levels of education (e.g., high school, bachelor’s, master’s).
- Interpretation: A significant ANOVA result indicates that there is a statistically significant difference between at least two of the group means. Post-hoc tests (e.g., Tukey’s HSD, Bonferroni) can be used to determine which specific group means differ significantly from each other.
Example Scenario:
A company wants to assess whether there is a difference in customer satisfaction scores (measured on a scale of 1 to 10) between three different customer service channels (phone, email, chat). The company collects data from a sample of customers who used each channel and calculates the average satisfaction score for each channel:
| Channel | Average Satisfaction Score |
|---|---|
| Phone | 7.5 |
| 6.8 | |
| Chat | 8.2 |
Using ANOVA, the company can determine if the differences in average satisfaction scores between the channels are statistically significant. If the ANOVA result is significant, post-hoc tests can be used to identify which specific channels differ significantly from each other.
3.3 T-Tests
T-tests are statistical methods used to compare the means of two groups. There are two main types of t-tests: independent samples t-test and paired samples t-test.
- Independent Samples T-Test: This test is used to compare the means of two independent groups. For example, you can use an independent samples t-test to compare the average test scores of students who received a new teaching method versus those who received a traditional teaching method.
- Paired Samples T-Test: This test is used to compare the means of two related groups. For example, you can use a paired samples t-test to compare the blood pressure of patients before and after taking a medication.
Example Scenario (Independent Samples T-Test):
A researcher wants to compare the effectiveness of two different weight loss programs (Program A, Program B). The researcher randomly assigns participants to one of the two programs and measures their weight loss after 12 weeks. The researcher calculates the average weight loss for each program:
| Program | Average Weight Loss (lbs) |
|---|---|
| A | 15.2 |
| B | 12.8 |
Using an independent samples t-test, the researcher can determine if the difference in average weight loss between the two programs is statistically significant.
Example Scenario (Paired Samples T-Test):
A clinic wants to assess the effectiveness of a new exercise program in reducing blood pressure. The clinic measures the blood pressure of patients before and after participating in the exercise program. The clinic calculates the average change in blood pressure for each patient:
| Patient | Blood Pressure Change (mmHg) |
|---|---|
| 1 | -10 |
| 2 | -8 |
| 3 | -12 |
| … | … |
Using a paired samples t-test, the clinic can determine if the average change in blood pressure is statistically significant, indicating that the exercise program is effective.
3.4 Regression Analysis with Dummy Variables
Regression analysis is a statistical method used to model the relationship between a dependent variable and one or more independent variables. When you want to include a qualitative variable in a regression analysis, you can create dummy variables to represent the categories of the qualitative variable.
- Application: This technique is useful when you want to assess the effect of a qualitative variable on a quantitative outcome variable while controlling for other factors. For example, you can use regression analysis with dummy variables to assess the effect of marital status (single, married, divorced) on income while controlling for education level and work experience.
- Interpretation: The coefficients of the dummy variables represent the difference in the outcome variable between each category of the qualitative variable and a reference category.
Example Scenario:
A researcher wants to investigate the relationship between job satisfaction (measured on a scale of 1 to 10) and employment sector (private, public, non-profit) while controlling for education level (years of schooling). The researcher creates two dummy variables: “is_public” (1 if the individual works in the public sector, 0 otherwise) and “is_nonprofit” (1 if the individual works in the non-profit sector, 0 otherwise). The reference category is the private sector.
The researcher estimates a regression model:
Job Satisfaction = β0 + β1 * Education + β2 * is_public + β3 * is_nonprofit + ε
The coefficients β2 and β3 represent the difference in job satisfaction between individuals working in the public and non-profit sectors, respectively, compared to those working in the private sector, after controlling for education level.
By using these statistical methods appropriately, researchers can effectively compare quantitative with qualitative variables and derive meaningful insights from their data.
4. Practical Examples and Case Studies
To illustrate the application of statistical methods for comparing quantitative with qualitative variables, let’s examine practical examples and case studies across various fields.
4.1 Example 1: Marketing Research
Scenario: A marketing team wants to understand the impact of different marketing channels (e.g., email, social media, paid advertising) on customer satisfaction scores (measured on a scale of 1 to 10).
Data Collection: The team collects data from a sample of customers, recording their satisfaction scores and the marketing channel through which they were primarily reached.
Analysis:
- Descriptive Statistics: Calculate the average satisfaction score for each marketing channel.
- ANOVA: Use ANOVA to determine if there are statistically significant differences in satisfaction scores between the marketing channels.
- Post-Hoc Tests: If ANOVA is significant, use post-hoc tests (e.g., Tukey’s HSD) to identify which specific marketing channels differ significantly from each other.
Interpretation: The marketing team can identify the most effective marketing channels for driving customer satisfaction and allocate resources accordingly. For example, if customers reached through social media have significantly higher satisfaction scores, the team may invest more in social media marketing efforts.
4.2 Example 2: Healthcare
Scenario: A healthcare provider wants to assess the relationship between patient demographics (e.g., age, gender, insurance type) and patient satisfaction with their healthcare experience (measured as “satisfied” or “dissatisfied”).
Data Collection: The provider collects data from a sample of patients, recording their demographic information and satisfaction ratings.
Analysis:
- Chi-Square Test: Use the Chi-Square test to determine if there is a statistically significant association between patient demographics (e.g., gender, insurance type) and patient satisfaction.
- Regression Analysis with Dummy Variables: Create dummy variables for the categories of the demographic variables (e.g., “is_male,” “is_private_insurance”) and use regression analysis to assess the effect of these variables on patient satisfaction while controlling for other factors.
Interpretation: The healthcare provider can identify demographic factors that are associated with patient satisfaction and develop targeted interventions to improve the healthcare experience for specific patient groups. For example, if patients with public insurance are more likely to be dissatisfied, the provider may implement initiatives to address their specific concerns.
4.3 Case Study 1: Education
Research Question: Does a student’s learning style (visual, auditory, kinesthetic) affect their academic performance (GPA)?
Data Collection: A researcher collects data from a sample of students, assessing their learning styles through a questionnaire and recording their GPAs.
Analysis:
-
One-Way ANOVA:
- Learning style is the independent variable (qualitative: visual, auditory, kinesthetic).
- GPA is the dependent variable (quantitative).
- ANOVA is used to compare the mean GPA across the three learning style groups.
-
Post-Hoc Tests:
- If ANOVA reveals a significant difference, post-hoc tests (e.g., Tukey’s HSD) are used to determine which pairs of learning styles have significantly different GPAs.
Interpretation: The researcher can determine if certain learning styles are associated with higher academic performance. This information can be used to tailor teaching methods to better suit students’ learning preferences.
4.4 Case Study 2: Human Resources
Research Question: Is there a relationship between employee job satisfaction (satisfied, neutral, dissatisfied) and employee turnover rate (number of employees leaving the company per year)?
Data Collection: An HR department collects data on employee job satisfaction through surveys and records the annual employee turnover rate.
Analysis:
-
Chi-Square Test:
- Job satisfaction is one categorical variable.
- Turnover rate can be categorized into levels (e.g., low, medium, high).
- The Chi-Square test assesses if there is a significant association between job satisfaction and turnover rate.
-
Contingency Tables:
- Data is organized into a contingency table to compare the observed frequencies with the expected frequencies.
Interpretation: The HR department can determine if lower job satisfaction is associated with higher employee turnover rates, which can inform strategies to improve employee morale and retention.
4.5 Case Study 3: Environmental Science
Research Question: Does the type of soil (clay, loam, sand) affect the growth rate of plants (measured in centimeters per month)?
Data Collection: A scientist conducts an experiment where plants are grown in different soil types, and their growth rates are measured monthly.
Analysis:
-
ANOVA:
- Soil type is the independent variable (qualitative: clay, loam, sand).
- Plant growth rate is the dependent variable (quantitative).
- ANOVA is used to compare the mean growth rate across the three soil types.
-
Post-Hoc Tests:
- If ANOVA is significant, post-hoc tests identify which specific soil types have significantly different effects on plant growth.
Interpretation: The scientist can determine the optimal soil type for plant growth, which has implications for agriculture and conservation efforts.
These examples and case studies demonstrate how statistical methods can be applied to compare quantitative with qualitative variables across various fields. By understanding the appropriate techniques and interpreting the results, researchers and practitioners can gain valuable insights and make informed decisions.
5. Best Practices for Data Analysis and Interpretation
When statistically comparing quantitative with qualitative variables, following best practices in data analysis and interpretation is crucial for ensuring the validity and reliability of the results.
5.1 Ensuring Data Quality
Data quality is paramount in any statistical analysis. Poor data quality can lead to inaccurate results and misleading conclusions.
- Data Validation: Implement data validation procedures to check for errors, inconsistencies, and missing values.
- Data Cleaning: Clean the data by correcting errors, handling missing values, and removing outliers.
- Data Transformation: Transform the data as necessary to meet the assumptions of the statistical tests (e.g., normalization, standardization).
5.2 Selecting Appropriate Statistical Tests
Choosing the right statistical test is essential for drawing valid conclusions. Consider the nature of the data (quantitative vs. qualitative), the research question, and the assumptions of the statistical tests.
- Consult Statistical Resources: Refer to statistical textbooks, online resources, and experts to determine the appropriate statistical tests for your research questions.
- Consider Assumptions: Check that the data meet the assumptions of the statistical tests (e.g., normality, independence, homogeneity of variance).
- Use Non-Parametric Tests: If the data do not meet the assumptions of parametric tests, consider using non-parametric alternatives (e.g., Mann-Whitney U test, Kruskal-Wallis test).
5.3 Interpreting Results Cautiously
Statistical significance does not always imply practical significance. Interpret the results cautiously and consider the context of the research.
- Consider Effect Size: Evaluate the magnitude of the effect (e.g., Cohen’s d, R-squared) in addition to statistical significance.
- Examine Confidence Intervals: Examine the confidence intervals to assess the precision of the estimates.
- Avoid Overgeneralization: Avoid overgeneralizing the results to populations or settings that are not represented in the sample.
5.4 Addressing Confounding Variables
Confounding variables can distort the relationship between the variables of interest. Take steps to identify and address confounding variables in the analysis.
- Control for Confounding Variables: Use statistical techniques such as regression analysis to control for confounding variables.
- Stratification: Stratify the analysis by the confounding variable to examine the relationship of interest within different subgroups.
- Propensity Score Matching: Use propensity score matching to create balanced groups that are comparable on the confounding variables.
5.5 Presenting Findings Clearly
Communicate the findings clearly and transparently, using appropriate visualizations and tables.
- Use Visualizations: Use graphs, charts, and other visualizations to illustrate the findings.
- Provide Context: Provide sufficient context to help the audience understand the research question, methods, and results.
- Discuss Limitations: Discuss the limitations of the research and potential sources of bias.
By following these best practices, researchers can ensure that their analyses are rigorous, their interpretations are sound, and their findings are communicated effectively.
6. Advanced Techniques and Considerations
Beyond the basic statistical methods, several advanced techniques and considerations can further enhance the analysis and interpretation when comparing quantitative with qualitative variables.
6.1 Mixed-Methods Research
Mixed-methods research involves combining both quantitative and qualitative data collection and analysis techniques in a single study. This approach can provide a more comprehensive understanding of the research question.
- Sequential Designs: Collect and analyze quantitative data first, followed by qualitative data to explore the quantitative findings in more depth, or vice versa.
- Concurrent Designs: Collect and analyze quantitative and qualitative data simultaneously and integrate the findings during the interpretation phase.
- Integrative Designs: Use qualitative data to develop quantitative measures or use quantitative data to select participants for qualitative interviews.
6.2 Qualitative Comparative Analysis (QCA)
QCA is a method used to identify the necessary and sufficient conditions for an outcome based on qualitative data. It uses Boolean algebra to analyze the relationships between different conditions and outcomes.
- Application: QCA is useful for identifying complex causal relationships in situations where there are multiple potential causes and no single cause is sufficient to produce the outcome.
- Data Requirements: QCA requires qualitative data that has been coded into binary values (0 or 1).
6.3 Mediation and Moderation Analysis
Mediation and moderation analysis are statistical techniques used to examine the mechanisms and conditions through which variables affect each other.
- Mediation: A mediator variable explains the relationship between an independent variable and a dependent variable.
- Moderation: A moderator variable affects the strength or direction of the relationship between an independent variable and a dependent variable.
6.4 Bayesian Statistics
Bayesian statistics is an approach to statistical inference that combines prior beliefs with observed data to update the probability of a hypothesis.
- Application: Bayesian statistics can be useful for incorporating prior knowledge and expert opinions into the analysis.
- Benefits: Bayesian methods can provide more intuitive and interpretable results than traditional frequentist methods.
6.5 Ethical Considerations
Ethical considerations are paramount in any research involving human subjects.
- Informed Consent: Obtain informed consent from participants before collecting data.
- Confidentiality: Protect the confidentiality of participants’ data.
- Beneficence: Maximize the benefits of the research while minimizing the risks.
- Justice: Ensure that the benefits and risks of the research are distributed fairly across different groups.
By incorporating these advanced techniques and considerations, researchers can conduct more sophisticated analyses and gain deeper insights into the relationships between quantitative and qualitative variables.
7. Tools and Resources for Data Analysis
Several tools and resources are available to assist researchers in statistically comparing quantitative with qualitative variables.
7.1 Statistical Software Packages
- SPSS: A widely used statistical software package for data analysis and reporting.
- SAS: A comprehensive statistical software suite for data management, analysis, and visualization.
- R: A free and open-source programming language and software environment for statistical computing and graphics.
- Stata: A statistical software package for data analysis, visualization, and simulation.
7.2 Spreadsheet Programs
- Microsoft Excel: A versatile spreadsheet program for data management, analysis, and visualization.
- Google Sheets: A cloud-based spreadsheet program that offers similar functionality to Excel.
7.3 Online Resources
- COMPARE.EDU.VN: Offers comprehensive comparisons and insights to help you make informed decisions regarding data analysis techniques and tools.
- Coursera and edX: Online learning platforms that offer courses on statistics, data analysis, and research methods.
- Khan Academy: A free online learning platform that offers tutorials on statistics and probability.
- University Websites: Many university websites offer free resources on statistical methods and data analysis.
7.4 Books and Publications
- “Statistics” by David Freedman, Robert Pisani, and Roger Purves: A classic textbook on statistical methods.
- “Discovering Statistics Using SPSS” by Andy Field: A user-friendly guide to statistical analysis using SPSS.
- “The Elements of Statistical Learning” by Trevor Hastie, Robert Tibshirani, and Jerome Friedman: A comprehensive textbook on statistical learning methods.
7.5 Professional Organizations
- American Statistical Association (ASA): A professional organization for statisticians and data scientists.
- Royal Statistical Society (RSS): A professional organization for statisticians in the United Kingdom.
- International Statistical Institute (ISI): An international organization for statisticians.
By leveraging these tools and resources, researchers can enhance their skills and knowledge in data analysis and improve the quality of their research.
8. Future Trends in Data Analysis
The field of data analysis is constantly evolving, with new techniques and technologies emerging all the time. Here are some future trends to watch for:
8.1 Artificial Intelligence (AI) and Machine Learning (ML)
AI and ML are increasingly being used for data analysis, automation, and prediction.
- Automated Data Analysis: AI and ML algorithms can automate many of the steps involved in data analysis, such as data cleaning, feature selection, and model building.
- Predictive Analytics: AI and ML can be used to build predictive models that forecast future outcomes based on historical data.
- Natural Language Processing (NLP): NLP techniques can be used to analyze qualitative data, such as text and speech, to extract insights and identify patterns.
8.2 Big Data Analytics
The volume, velocity, and variety of data are increasing exponentially, leading to the rise of big data analytics.
- Hadoop and Spark: These are open-source frameworks for processing and analyzing large datasets.
- Cloud Computing: Cloud computing platforms provide scalable and cost-effective resources for storing and processing big data.
- Data Visualization: Advanced data visualization techniques are needed to explore and communicate insights from big data.
8.3 Data Integration and Harmonization
Data is often scattered across different systems and formats, making it difficult to analyze.
- Data Warehousing: Data warehousing involves consolidating data from different sources into a central repository.
- Data Lakes: Data lakes provide a flexible and scalable storage solution for unstructured and semi-structured data.
- Data Governance: Data governance policies and procedures are needed to ensure data quality, security, and compliance.
8.4 Real-Time Analytics
The demand for real-time insights is increasing, leading to the development of real-time analytics techniques.
- Streaming Data: Streaming data is data that is generated continuously over time, such as sensor data and social media feeds.
- Complex Event Processing (CEP): CEP techniques are used to detect patterns and anomalies in streaming data.
- Real-Time Dashboards: Real-time dashboards provide up-to-the-minute insights into key performance indicators.
8.5 Ethical and Responsible AI
As AI and ML become more prevalent, there is a growing concern about the ethical implications of these technologies.
- Bias Detection and Mitigation: Techniques are needed to detect and mitigate bias in AI and ML algorithms.
- Transparency and Explainability: AI and ML models should be transparent and explainable so that users can understand how they work and why they make certain predictions.
- Accountability: There should be clear lines of accountability for the decisions made by AI and ML systems.
By staying abreast of these future trends, researchers and practitioners can prepare themselves for the challenges and opportunities that lie ahead in the field of data analysis.
9. Conclusion: Enhancing Research with Strategic Data Comparison
The ability to statistically compare quantitative with qualitative variables is a valuable skill for researchers and practitioners across various fields. By understanding the nature of these data types, selecting appropriate statistical methods, and following best practices in data analysis and interpretation, it is possible to derive meaningful insights and make informed decisions.
At COMPARE.EDU.VN, we are dedicated to providing you with the knowledge and resources you need to excel in data analysis. We offer comprehensive comparisons of data analysis techniques, software tools, and online courses to help you choose the best options for your specific needs.
Remember, the key to successful data analysis lies in strategic planning, rigorous execution, and thoughtful interpretation. Whether you are conducting marketing research, analyzing healthcare data, or studying environmental phenomena, the principles outlined in this article will help you unlock the full potential of your data.
10. Call to Action: Explore Comprehensive Data Analysis Solutions at COMPARE.EDU.VN
Ready to take your data analysis skills to the next level? Visit COMPARE.EDU.VN today to explore our comprehensive comparisons of data analysis techniques, software tools, and online courses. Discover the resources you need to excel in your research and make data-driven decisions with confidence.
For further assistance or inquiries, please contact us at:
Address: 333 Comparison Plaza, Choice City, CA 90210, United States
WhatsApp: +1 (626) 555-9090
Website: COMPARE.EDU.VN
Let compare.edu.vn be your trusted partner in data analysis, helping you turn raw data into actionable insights.