Comparing t-values between different analyses can be complex, but understanding the nuances is crucial for accurate statistical interpretation. COMPARE.EDU.VN provides a detailed breakdown to help you navigate these comparisons effectively, offering solutions to common analytical challenges. Gain insights into statistical significance, hypothesis testing, and data interpretation to make informed decisions.
1. What Is a T-Value and Why Is It Important?
The t-value is a statistical measure that determines if there is a significant difference between the means of two groups or between a sample mean and a population mean. It’s a crucial component in hypothesis testing, helping researchers and analysts make informed decisions based on data.
1.1. Defining the T-Value
The t-value, also known as the t-statistic, quantifies the difference between the sample mean and the population mean in terms of the standard error. In simpler terms, it measures how far away the sample mean is from the population mean, relative to the variability in the sample. A larger t-value indicates a greater difference, suggesting stronger evidence against the null hypothesis.
1.2. Importance in Hypothesis Testing
In hypothesis testing, the goal is to determine whether there is enough evidence to reject the null hypothesis. The null hypothesis assumes that there is no significant difference between the groups being compared. The t-value is used to calculate the p-value, which represents the probability of observing the obtained results (or more extreme results) if the null hypothesis were true. If the p-value is below a predetermined significance level (usually 0.05), the null hypothesis is rejected, indicating a statistically significant difference.
1.3. Types of T-Tests
There are several types of t-tests, each suited for different scenarios:
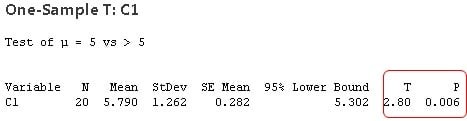
- One-Sample T-Test: Used to compare the mean of a single sample to a known population mean. For instance, a researcher might use a one-sample t-test to determine whether the average height of students in a particular school differs significantly from the national average height.
- Independent Samples T-Test (Two-Sample T-Test): Used to compare the means of two independent groups. For example, a company might use an independent samples t-test to compare the sales performance of two different marketing strategies.
- Paired Samples T-Test (Dependent Samples T-Test): Used to compare the means of two related groups, such as pre- and post-test scores for the same individuals. A medical study might use a paired samples t-test to assess the effectiveness of a treatment by comparing patients’ conditions before and after the treatment.
1.4. Components Influencing the T-Value
Several factors influence the t-value:
- Difference Between Means: The greater the difference between the sample mean(s) and the population mean (or between two sample means), the larger the t-value.
- Sample Size: Larger sample sizes tend to produce more reliable results. As the sample size increases, the standard error decreases, leading to a larger t-value.
- Variability: Higher variability within the sample data (indicated by a larger standard deviation) results in a smaller t-value, as the difference between means is less distinguishable amidst the noise.
Understanding these components is vital for interpreting the significance of your t-value in different analyses.
2. Understanding When T-Value Comparisons Are Appropriate
Comparing t-values across different analyses can be misleading if not done correctly. Understanding the conditions under which such comparisons are appropriate is crucial for drawing accurate conclusions.
2.1. Importance of Context
The context of each analysis plays a significant role in determining whether t-value comparisons are meaningful. Factors such as the study design, sample characteristics, and specific hypotheses being tested all contribute to the interpretation of the t-value.
2.2. Similar Study Designs
T-values are most directly comparable when the study designs are similar. This includes having the same type of t-test (e.g., independent samples t-test), similar sample sizes, and comparable levels of variance within the data.
2.3. Standardized Variables
If the variables being compared are measured on different scales, it may be necessary to standardize them. Standardization involves converting the variables to a common scale, such as z-scores, which have a mean of 0 and a standard deviation of 1. This allows for a more direct comparison of the t-values.
2.4. Identical Hypotheses
The hypotheses being tested in each analysis should be conceptually similar. For example, comparing t-values from two studies both testing the effectiveness of a new drug on reducing blood pressure is more meaningful than comparing t-values from studies testing unrelated outcomes.
2.5. Factors Affecting Comparability
Several factors can limit the comparability of t-values:
- Different Sample Sizes: T-values are influenced by sample size, so comparing t-values from studies with vastly different sample sizes can be misleading.
- Unequal Variances: If the variances of the groups being compared are significantly different, the t-value may not accurately reflect the true difference between the means.
- Non-Normal Data: T-tests assume that the data are normally distributed. If this assumption is violated, the t-value may not be reliable.
2.6. Example Scenario
Consider two separate studies:
- Study A: Examines the effect of a new teaching method on test scores in a class of 30 students.
- Study B: Examines the effect of the same teaching method on test scores in a class of 100 students.
Comparing the t-values directly may not be appropriate because of the different sample sizes. A more valid approach might involve examining the effect sizes or using meta-analysis techniques to combine the results of the two studies.
3. Situations Where T-Value Comparisons Are Problematic
While comparing t-values might seem straightforward, certain conditions can make such comparisons unreliable and misleading. Recognizing these situations is essential for accurate data interpretation.
3.1. Different Types of T-Tests
Comparing t-values from different types of t-tests (e.g., one-sample vs. independent samples) is generally inappropriate. Each test is designed for a specific type of comparison, and the t-values are calculated differently.
3.2. Varying Sample Sizes
As previously mentioned, sample size significantly impacts the t-value. Comparing t-values from studies with substantially different sample sizes can lead to incorrect conclusions about the magnitude of the effect.
3.3. Heterogeneous Variances
The assumption of equal variances (homogeneity of variance) is critical for the independent samples t-test. If the variances are significantly different, the t-value may not accurately reflect the true difference between the means.
3.4. Non-Normal Data
T-tests assume that the data are normally distributed. If the data deviate significantly from normality, the t-value may be unreliable. In such cases, non-parametric tests (e.g., Mann-Whitney U test) may be more appropriate.
3.5. Different Dependent Variables
Comparing t-values across studies that use different dependent variables is often meaningless. For example, comparing a t-value from a study measuring blood pressure to a t-value from a study measuring cholesterol levels provides no useful information.
3.6. Example Scenario
Imagine two research projects:
- Project 1: Tests the effectiveness of a weight loss program on a group of 20 participants using a paired samples t-test.
- Project 2: Tests the effectiveness of a different weight loss program on a group of 100 participants using an independent samples t-test.
Directly comparing the t-values from these two projects is problematic due to the different types of t-tests and the differing sample sizes.
3.7. Impact of Outliers
Outliers, or extreme values, can disproportionately influence the t-value. If one dataset contains outliers and another does not, comparing their t-values can be misleading. It is crucial to identify and address outliers appropriately.
4. Alternative Methods for Comparing Results Across Analyses
When direct comparison of t-values is inappropriate, several alternative methods can be used to compare results across different analyses. These methods provide more accurate and meaningful comparisons.
4.1. Effect Sizes
Effect sizes provide a standardized measure of the magnitude of an effect, independent of sample size. Common effect size measures include Cohen’s d, Pearson’s r, and eta-squared.
- Cohen’s d: Represents the difference between two means in terms of standard deviations. It is widely used for t-tests and ANOVA.
- Pearson’s r: Measures the strength and direction of the linear relationship between two variables. It is commonly used in correlation analyses.
- Eta-Squared: Represents the proportion of variance in the dependent variable that is explained by the independent variable. It is often used in ANOVA.
4.2. Confidence Intervals
Confidence intervals provide a range of values within which the true population parameter is likely to fall. Comparing confidence intervals across different analyses can help determine whether the results are consistent.
4.3. Meta-Analysis
Meta-analysis is a statistical technique used to combine the results of multiple studies that address the same research question. It provides a more precise estimate of the effect size and can help identify patterns and inconsistencies across studies.
4.4. Bayesian Analysis
Bayesian analysis provides a framework for updating beliefs based on new evidence. It can be used to compare the results of different analyses by calculating Bayes factors, which represent the relative evidence for one hypothesis over another.
4.5. Example Scenario
Consider three separate studies investigating the impact of exercise on weight loss:
- Study 1: Reports a t-value of 2.5 with a sample size of 30.
- Study 2: Reports a t-value of 3.0 with a sample size of 50.
- Study 3: Reports a t-value of 2.0 with a sample size of 100.
Instead of directly comparing the t-values, you could calculate Cohen’s d for each study and compare those values. Alternatively, you could conduct a meta-analysis to combine the results of the three studies and obtain a more precise estimate of the effect of exercise on weight loss.
4.6. Practical Significance vs. Statistical Significance
It’s also important to consider practical significance in addition to statistical significance. A statistically significant result may not be practically meaningful if the effect size is small.
5. How to Properly Interpret T-Values in Research
Interpreting t-values correctly is essential for drawing valid conclusions from research data. This involves understanding the factors that influence the t-value and considering the context of the analysis.
5.1. Understanding Degrees of Freedom
The degrees of freedom (df) represent the number of independent pieces of information available to estimate a parameter. For a one-sample t-test, df = n – 1, where n is the sample size. For an independent samples t-test, df = n1 + n2 – 2, where n1 and n2 are the sample sizes of the two groups. The degrees of freedom are used to determine the critical value of t, which is the value that the t-value must exceed in order to reject the null hypothesis.
5.2. Determining Statistical Significance
Statistical significance is determined by comparing the p-value to a predetermined significance level (alpha), typically 0.05. If the p-value is less than alpha, the null hypothesis is rejected, indicating a statistically significant difference.
5.3. Considering the Direction of the Effect
The sign of the t-value indicates the direction of the effect. A positive t-value indicates that the sample mean is greater than the population mean (or that the mean of group 1 is greater than the mean of group 2). A negative t-value indicates the opposite.
5.4. Reporting T-Values
When reporting t-values in research papers, it is important to include the following information:
- The t-value
- The degrees of freedom
- The p-value
- The type of t-test used
- The sample size(s)
- The means and standard deviations of the groups being compared
5.5. Example Interpretation
Suppose a researcher conducts an independent samples t-test to compare the test scores of students who received a new tutoring program (group 1) to those who did not (group 2). The results are as follows:
- t = 2.75
- df = 58
- p = 0.008
- Group 1: Mean = 85, SD = 8, n = 30
- Group 2: Mean = 78, SD = 10, n = 30
The researcher would interpret these results as follows:
“An independent samples t-test was conducted to compare the test scores of students who received the new tutoring program to those who did not. The results indicated a statistically significant difference between the two groups (t(58) = 2.75, p = 0.008). Students who received the tutoring program (M = 85, SD = 8) scored significantly higher than those who did not (M = 78, SD = 10).”
5.6. Using T-Values in Decision-Making
T-values play a critical role in decision-making across various fields:
- Healthcare: Assessing the effectiveness of new treatments or therapies.
- Education: Evaluating the impact of different teaching methods on student performance.
- Business: Comparing the effectiveness of different marketing strategies or product designs.
- Social Sciences: Studying the effects of social programs or interventions on various outcomes.
6. Advanced Considerations for T-Value Analysis
For more in-depth analysis, consider these advanced topics related to t-values and statistical comparisons.
6.1. Welch’s T-Test
When the assumption of equal variances is violated, Welch’s t-test is a more robust alternative to the independent samples t-test. Welch’s t-test does not assume equal variances and provides a more accurate p-value when the variances are significantly different.
6.2. Bootstrapping
Bootstrapping is a resampling technique that can be used to estimate the standard error and confidence interval for the t-value. Bootstrapping is particularly useful when the data do not meet the assumptions of the t-test (e.g., non-normality).
6.3. Power Analysis
Power analysis is used to determine the sample size needed to detect a statistically significant effect with a certain level of confidence. A power analysis can help researchers avoid Type II errors (failing to reject a false null hypothesis).
6.4. Multiple Comparisons
When conducting multiple t-tests, the risk of making a Type I error (rejecting a true null hypothesis) increases. To address this issue, researchers often use multiple comparisons corrections, such as the Bonferroni correction or the Benjamini-Hochberg procedure.
6.5. Non-Parametric Alternatives
When the assumptions of the t-test are violated, non-parametric alternatives, such as the Mann-Whitney U test or the Wilcoxon signed-rank test, may be more appropriate.
6.6. Example Scenario
A researcher is conducting a study with multiple groups and suspects that the data may not be normally distributed. In this case, the researcher might choose to use the Kruskal-Wallis test (a non-parametric alternative to ANOVA) followed by post-hoc tests with a Bonferroni correction to control for multiple comparisons.
6.7. The Role of Technology
Statistical software packages such as R, SPSS, and SAS provide tools for conducting t-tests, calculating effect sizes, and performing power analyses. These tools can help researchers conduct more rigorous and accurate analyses.
7. Practical Examples of T-Value Comparisons
Understanding how t-value comparisons are applied in real-world scenarios can provide valuable insights.
7.1. Medical Research
In medical research, t-tests are often used to compare the effectiveness of new treatments to existing treatments. For example, a researcher might use an independent samples t-test to compare the blood pressure of patients who received a new drug to those who received a placebo.
7.2. Education
In education, t-tests can be used to evaluate the impact of different teaching methods on student performance. For example, a researcher might use a paired samples t-test to compare students’ scores before and after a new teaching intervention.
7.3. Business Analytics
In business, t-tests are used to compare the performance of different marketing strategies, product designs, or business processes. For example, a company might use an independent samples t-test to compare the sales generated by two different advertising campaigns.
7.4. Social Sciences
In the social sciences, t-tests are used to study the effects of social programs or interventions on various outcomes, such as employment rates, crime rates, or educational attainment.
7.5. Example Scenario
A company wants to determine whether a new customer service training program improves customer satisfaction. They conduct a paired samples t-test, comparing customer satisfaction scores before and after the training program. The results show a statistically significant increase in customer satisfaction scores, indicating that the training program is effective.
7.6. Using T-Tests in A/B Testing
A/B testing is a common technique used in marketing and web development to compare two versions of a webpage or advertisement. T-tests are often used to determine whether the difference in conversion rates between the two versions is statistically significant.
8. Common Mistakes to Avoid When Comparing T-Values
Avoiding common pitfalls when comparing t-values is crucial for maintaining the integrity of your analysis and interpretations.
8.1. Ignoring Assumptions
Failing to check the assumptions of the t-test (normality, equal variances) can lead to incorrect conclusions. Always verify that the assumptions are met before interpreting the t-value.
8.2. Overemphasizing Statistical Significance
Focusing solely on statistical significance without considering the practical significance of the effect can be misleading. A statistically significant result may not be meaningful if the effect size is small.
8.3. Comparing Apples and Oranges
Comparing t-values from different types of t-tests or studies with different designs is inappropriate. Ensure that the comparisons are valid and meaningful.
8.4. Ignoring Multiple Comparisons
Failing to correct for multiple comparisons when conducting multiple t-tests can inflate the risk of Type I errors. Use appropriate correction methods to control for this risk.
8.5. Misinterpreting P-Values
The p-value represents the probability of observing the obtained results (or more extreme results) if the null hypothesis were true. It does not represent the probability that the null hypothesis is true or the probability that the alternative hypothesis is true.
8.6. Example Scenario
A researcher conducts multiple t-tests without correcting for multiple comparisons and finds several statistically significant results. However, after applying a Bonferroni correction, none of the results remain significant. The researcher should conclude that there is no strong evidence to reject the null hypothesis for any of the comparisons.
8.7. The Dangers of Data Dredging
Data dredging, or p-hacking, involves repeatedly analyzing data in different ways until a statistically significant result is found. This practice can lead to false positives and should be avoided.
9. Resources for Further Learning
To deepen your understanding of t-values and statistical comparisons, consider these resources.
9.1. Textbooks
- “Statistics” by David Freedman, Robert Pisani, and Roger Purves
- “Statistical Methods for Psychology” by David Howell
- “Discovering Statistics Using SPSS” by Andy Field
9.2. Online Courses
- Coursera: “Statistics with R”
- edX: “Introduction to Statistics”
- Khan Academy: “Statistics and Probability”
9.3. Statistical Software Documentation
- R Documentation
- SPSS Documentation
- SAS Documentation
9.4. Academic Journals
- Journal of Applied Statistics
- Biometrics
- Psychological Methods
9.5. Statistical Blogs and Websites
- Cross Validated (Stack Exchange)
- StatsExchange
- COMPARE.EDU.VN – Your go-to resource for comprehensive comparisons and informed decision-making.
9.6. Workshops and Seminars
Attend workshops and seminars offered by universities, research institutions, and professional organizations to learn from experts in the field.
9.7. Engaging with Statistical Communities
Join online forums and communities where you can ask questions, share insights, and learn from other researchers and statisticians.
10. Conclusion: Making Informed Decisions with T-Value Comparisons
Comparing t-values between analyses requires careful consideration of the context, study design, and assumptions. When direct comparison is inappropriate, alternative methods such as effect sizes, confidence intervals, and meta-analysis can provide more meaningful insights. By understanding the nuances of t-value interpretation and avoiding common mistakes, researchers and analysts can make more informed decisions based on their data.
When assessing the differences in statistical analyses, consider various factors that may impact the reliability of t-value comparisons. Variables such as sample size, differing study designs, and inherent data variations can skew results, leading to misinterpretations. Employing careful consideration and supplementary analyses will significantly improve the precision of your research conclusions.
Ready to make smarter, data-driven decisions? Visit COMPARE.EDU.VN today for detailed comparisons and expert analysis.
Don’t let complex data overwhelm you. At COMPARE.EDU.VN, we provide clear, objective comparisons to help you make the right choices. Whether you’re evaluating products, services, or ideas, our platform offers the insights you need. Explore COMPARE.EDU.VN today and discover how easy it can be to make informed decisions. Our team of experts is dedicated to providing you with the most accurate and up-to-date information, empowering you to make confident choices every time.
Contact Us:
Address: 333 Comparison Plaza, Choice City, CA 90210, United States
Whatsapp: +1 (626) 555-9090
Website: compare.edu.vn
FAQ: Understanding T-Values and Statistical Comparisons
1. What is a t-value?
The t-value, or t-statistic, is a measure of the difference between a sample mean and a population mean, expressed in terms of the standard error. It is used to determine whether the difference is statistically significant.
2. How is the t-value calculated?
The formula for the t-value depends on the type of t-test being used. For a one-sample t-test, the formula is: t = (sample mean – population mean) / (sample standard deviation / sqrt(sample size)).
3. What is a p-value?
The p-value represents the probability of observing the obtained results (or more extreme results) if the null hypothesis were true. A small p-value (typically less than 0.05) indicates strong evidence against the null hypothesis.
4. How do I interpret a t-value?
A large t-value indicates a greater difference between the means being compared. The p-value associated with the t-value is used to determine whether the difference is statistically significant.
5. Can I compare t-values from different studies?
Comparing t-values from different studies can be problematic if the studies have different designs, sample sizes, or variables. It is often more appropriate to compare effect sizes or use meta-analysis techniques.
6. What are effect sizes?
Effect sizes are standardized measures of the magnitude of an effect, independent of sample size. Common effect size measures include Cohen’s d, Pearson’s r, and eta-squared.
7. What is meta-analysis?
Meta-analysis is a statistical technique used to combine the results of multiple studies that address the same research question. It provides a more precise estimate of the effect size and can help identify patterns and inconsistencies across studies.
8. What are the assumptions of a t-test?
The assumptions of a t-test include normality of the data, homogeneity of variance (equal variances between groups), and independence of observations.
9. What is Welch’s t-test?
Welch’s t-test is a variant of the independent samples t-test that does not assume equal variances. It is more robust than the standard t-test when the variances are significantly different.
10. What are non-parametric alternatives to the t-test?
Non-parametric alternatives to the t-test include the Mann-Whitney U test (for independent samples) and the Wilcoxon signed-rank test (for paired samples). These tests do not assume normality of the data.