Comparing pages in Google Analytics 4 (GA4) is indeed possible, enabling you to gain valuable insights into your website’s performance. This guide, brought to you by COMPARE.EDU.VN, will thoroughly explore how to compare pages, analyze user behavior, and optimize your content strategy. Learn how comparisons, segments, and audiences can help you understand your data more effectively.
1. Understanding Comparisons in Google Analytics 4
Comparisons in GA4 offer a swift method to juxtapose different data subsets within standard reports. This functionality serves as an alternative to the segments used in earlier Google Analytics versions, but there are significant differences. This functionality helps users to compare and contrast information, identify patterns, and make informed decisions.
1.1. What Are Comparisons in GA4?
Comparisons in Google Analytics 4 (GA4) allow you to analyze different subsets of data in standard reports. They enable you to quickly compare metrics and dimensions, offering insights into how different segments of your audience behave. This is useful for comparing different groups of users, traffic sources, or time periods.
1.2. Why Use Comparisons?
Comparisons help you quickly identify trends and patterns in your data, enabling informed decisions about your website and marketing strategies.
- Identify High-Performing Content: See which pages drive the most engagement.
- Understand User Behavior: Learn how different user segments interact with your site.
- Optimize Marketing Campaigns: Tailor your strategies based on user behavior data.
- Enhance User Experience: Improve site navigation and content presentation based on user interactions.
2. Step-by-Step Guide to Comparing Pages in GA4
Comparing pages in Google Analytics 4 involves several steps. This section will guide you through the process, from creating comparisons to analyzing the data.
2.1. Accessing the Comparisons Feature
- Open Google Analytics 4: Navigate to the GA4 property for your website.
- Go to Standard Reports: Select “Reports” from the left-hand navigation menu.
- Choose a Report: Select a standard report, such as “Pages and screens.”
- Add Comparison: Look for the “Add comparison” option, typically located at the top left of the report.
2.2. Creating a New Comparison
Once you’ve accessed the Comparisons feature, you can create a new comparison by following these steps:
-
Click “Add Comparison”: This opens a sidebar for configuring your comparison.
-
Set Conditions: Define the criteria for your comparison. You can choose to include or exclude data based on specific dimensions and metrics.
-
Select Dimensions: Choose the dimension you want to use for comparison. For pages, the primary dimension is usually “Page path and screen class.”
-
Enter Values: Specify the page paths you want to compare. You can enter multiple page paths to compare different sections of your website.
-
Apply: Click “Apply” to create the comparison.
2.3. Example: Comparing Two Specific Pages
Let’s say you want to compare the performance of your homepage (/) with a specific product page (/product-a).
- Include: Select “Include” to focus on data matching your criteria.
- Dimension: Choose “Page path and screen class.”
- Values: Enter
/for the homepage. - Apply: Click “Apply.”
- Add Another Comparison: Click “Add Comparison” again.
- Include: Select “Include.”
- Dimension: Choose “Page path and screen class.”
- Values: Enter
/product-afor the product page. - Apply: Click “Apply.”
- Remove All Users: Remove the default “All Users” option by clicking the “X” on its label to focus solely on your comparisons.
2.4. Analyzing the Results
After setting up your comparisons, GA4 will display the data side-by-side in the report. This allows you to quickly see how different pages perform across various metrics.
- Review Metrics: Look at key metrics like “Users,” “Sessions,” “Engagement rate,” and “Conversions.”
- Identify Trends: Observe how these metrics differ between the compared pages.
- Use Visualizations: GA4 provides charts and graphs to help visualize the data. Line charts will show multiple lines for each comparison, while bar charts and tables will present side-by-side comparisons.
2.5. Editing Comparisons
To modify an existing comparison or add more, follow these steps:
-
Edit Comparisons Icon: Click the “Edit comparisons” icon in the top-right corner of the GA4 interface.
-
Adjust Conditions: Change the include/exclude criteria, dimensions, or values as needed.
-
Apply Changes: Click “Apply” to update the comparison.
3. Advanced Techniques for Page Comparison
To get the most out of GA4 comparisons, consider these advanced techniques.
3.1. Using Segments with Comparisons
Segments allow you to filter your data based on specific user characteristics or behaviors. Combining segments with comparisons can provide deeper insights into how different user groups interact with your pages.
- Create Segments: Define segments based on demographics, acquisition channels, or user behavior.
- Apply Segments: Use these segments as dimensions in your comparisons to see how different user groups perform on specific pages.
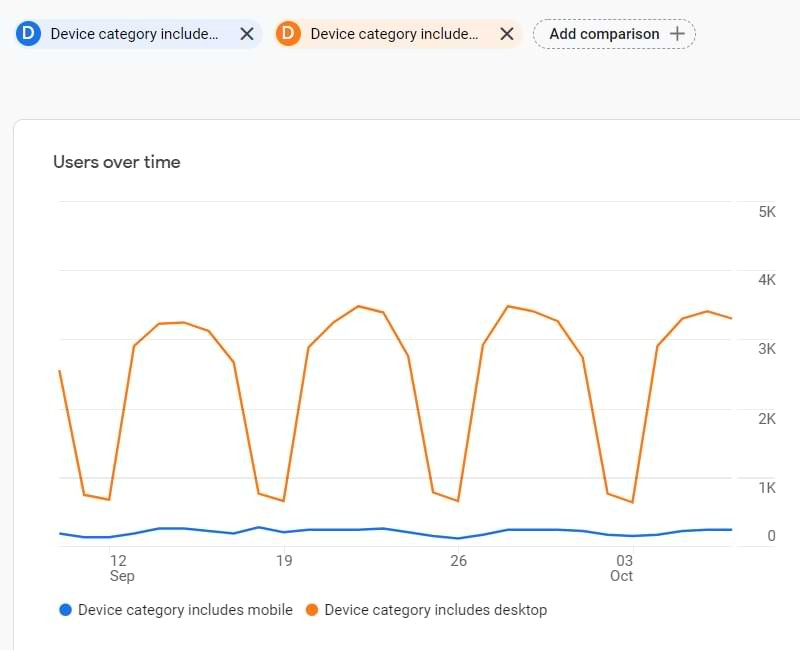
For example, you could compare the performance of your homepage among mobile users versus desktop users by creating segments for each device category and then using those segments in your page comparisons.
3.2. Comparing Different Time Periods
Analyzing how page performance changes over time can reveal trends and patterns. GA4 allows you to compare different time periods to see how your pages are performing.
- Set Date Range: In the report, adjust the date range to the period you want to analyze.
- Compare Date Ranges: Use the “Compare” option to select a previous period for comparison.
- Analyze Changes: See how metrics like “Users” and “Conversions” have changed between the two periods for the pages you are comparing.
This can help you identify the impact of marketing campaigns, website updates, or seasonal trends on your page performance.
3.3. Using Audiences in Comparisons
Audiences are groups of users with specific characteristics or behaviors. By using audiences in your comparisons, you can gain insights into how different user groups interact with your pages.
- Create Audiences: Define audiences based on demographics, interests, or behavior. For instance, create an audience of users who have abandoned their shopping carts.
- Apply Audiences: Use these audiences as dimensions in your comparisons to see how they perform on specific pages.
For example, you can compare the performance of a product page among users who have previously purchased from your site versus those who have not.
3.4. Exporting Comparisons to Explorations
For deeper analysis, you can export comparisons to GA4’s Exploration tool. This allows you to use more advanced analysis techniques and create custom reports.
-
Edit Comparison: Go to a standard report (e.g., Reports > Engagement > Events) and click the Edit comparison icon.
-
Explore: At the bottom of the comparison sidebar, you will find a button, Explore.
-
Analyze in Exploration: This will redirect you to a Free Form Exploration, where the same dimensions, metrics, and comparisons will be included as segments.
4. Understanding Segments, Audiences, and Comparisons
Understanding the differences between segments, audiences, and comparisons is essential for effective data analysis in GA4. Each feature serves a different purpose and has unique capabilities.
4.1. Segments
- Usage: Segments are used exclusively in Explorations for in-depth analysis.
- Scope: Segments are not shared between separate explorations.
- Google Ads: Cannot be used directly in Google Ads, but you can build an audience based on a segment.
- Retroactivity: Segments are retroactive, showing past data based on your conditions.
4.2. Audiences
-
Usage: Primarily built to be used in Google Ads as remarketing audiences.
-
Standard Reports: Can be used as a dimension in comparisons within standard reports.
-
Google Ads: Directly used in Google Ads for retargeting and custom audience creation.
-
Retroactivity: Audiences are not retroactive; they start collecting data only after creation.
4.3. Comparisons
- Usage: Designed for quick analysis and comparisons in standard reports.
- Explorations: Cannot be used directly in explorations but can be exported to create segments.
- Google Ads: Cannot be used directly in Google Ads, but can be converted to segments and then audiences.
- Retroactivity: Comparisons are retroactive unless they use an audience as a dimension.
5. Limitations of Comparisons
While comparisons are a powerful tool, they have certain limitations that you should be aware of.
5.1. Standard Reports Only
Comparisons are limited to standard reports and cannot be directly used in explorations. For in-depth analysis, you need to export comparisons to explorations as segments.
5.2. Limited Conditions
You can add up to 5 conditions in a single comparison. While this is often sufficient for quick checks, it may not be enough for more complex analyses.
5.3. No OR Conditions
All conditions in comparisons are connected with AND. The absence of OR conditions can limit the flexibility of your comparisons.
5.4. Limited Number of Comparisons
You can have up to 4 comparisons at the same time. Exceeding this limit can make reports crowded and difficult to interpret.
5.5. Comparisons Are Not Saved
Comparisons are not saved automatically. If you close the browser window, your comparisons will be lost, and you will have to recreate them from scratch.
5.6. Missing Dimensions
Some useful dimensions, such as page path, are missing from the comparisons feature. This can limit your ability to compare data based on specific URL structures.
6. Best Practices for Comparing Pages in GA4
To maximize the effectiveness of page comparisons in GA4, consider the following best practices.
6.1. Define Clear Objectives
Before creating comparisons, define clear objectives for your analysis. What specific questions are you trying to answer? What insights are you hoping to gain?
6.2. Use Relevant Metrics
Select the metrics that are most relevant to your objectives. Focus on metrics that provide actionable insights into user behavior and page performance.
6.3. Combine Comparisons with Segments
Leverage segments to gain a deeper understanding of how different user groups interact with your pages. This can reveal valuable insights for optimizing your content and marketing strategies.
6.4. Compare Time Periods
Analyze how page performance changes over time to identify trends and patterns. This can help you assess the impact of website updates, marketing campaigns, and seasonal trends.
6.5. Regularly Review and Update Comparisons
Comparisons should be regularly reviewed and updated to reflect changes in your website and user behavior. This ensures that your analyses remain relevant and accurate.
6.6. Document Your Findings
Keep a record of your findings and the actions you take based on those findings. This will help you track the impact of your optimization efforts and inform future analyses.
7. Real-World Examples of Page Comparisons
Here are some real-world examples of how you can use page comparisons in GA4 to gain actionable insights.
7.1. Comparing Landing Pages
Compare the performance of different landing pages to see which ones are most effective at driving conversions. Analyze metrics like bounce rate, engagement rate, and conversion rate to identify areas for improvement.
7.2. Analyzing Product Pages
Compare the performance of different product pages to see which ones are most popular and effective at driving sales. Look at metrics like page views, add-to-cart rate, and purchase rate to identify opportunities for optimizing your product listings.
7.3. Evaluating Blog Posts
Compare the performance of different blog posts to see which ones are most engaging and effective at driving traffic. Analyze metrics like page views, time on page, and social shares to identify topics that resonate with your audience.
7.4. Assessing Content Updates
Compare the performance of pages before and after content updates to see how the changes have impacted user behavior. Look at metrics like bounce rate, time on page, and conversion rate to assess the effectiveness of your updates.
7.5. Understanding User Journeys
Compare the performance of different pages within a user journey to see how users are navigating your website. Analyze metrics like page views, drop-off rate, and goal completion rate to identify areas where users are encountering friction.
8. Frequently Asked Questions (FAQs)
8.1. Can I compare more than two pages at once?
Yes, you can compare up to four different subsets of data simultaneously in Google Analytics 4 comparisons, but it is not recommended due to the fact that the reports will go from already crowded to impossible to use.
8.2. Are comparisons retroactive?
Comparisons are retroactive, meaning they will show past data based on the conditions you set. However, if you use an audience as a dimension in one of the comparisons, that comparison will not be retroactive unless the audience has been collecting data for a certain period.
8.3. Can I save my comparisons for future use?
No, comparisons are not saved automatically in Google Analytics 4. If you close the browser window, your comparisons will be lost, and you will have to recreate them from scratch.
8.4. Can I use comparisons in explorations?
No, comparisons are limited to standard reports in Google Analytics 4. However, you can export comparisons to explorations, where they will be converted into segments.
8.5. How do I compare different time periods for a specific page?
To compare different time periods for a specific page, adjust the date range in the report and use the “Compare” option to select a previous period for comparison. This will show you how metrics like “Users” and “Conversions” have changed between the two periods.
8.6. What metrics should I focus on when comparing pages?
The metrics you focus on will depend on your objectives, but some key metrics to consider include:
- Users
- Sessions
- Engagement rate
- Conversion rate
- Bounce rate
- Time on page
8.7. How can I use segments with comparisons to get more insights?
By using segments as dimensions in your comparisons, you can gain insights into how different user groups interact with your pages. For example, you can compare the performance of your homepage among mobile users versus desktop users by creating segments for each device category and then using those segments in your page comparisons.
8.8. What are the limitations of using comparisons in Google Analytics 4?
Some limitations of using comparisons in Google Analytics 4 include:
- Comparisons are limited to standard reports.
- You can add up to 5 conditions in a single comparison.
- All conditions in comparisons are connected with AND.
- You can have up to 4 comparisons at the same time.
- Comparisons are not saved automatically.
- Some useful dimensions are missing.
8.9. How can I improve the performance of my pages based on comparisons?
Based on the insights you gain from comparing pages, you can take several actions to improve their performance, including:
- Optimizing content
- Improving site navigation
- Enhancing user experience
- Targeting specific user groups
- Adjusting marketing strategies
8.10. Where can I find more resources on using Google Analytics 4?
You can find more resources on using Google Analytics 4 from various sources, including:
- Google Analytics 4 Help Center
- Online courses and tutorials
- Industry blogs and forums
- Google Analytics community
9. Conclusion: Leveraging Comparisons for Data-Driven Decisions
Google Analytics 4 comparisons are a powerful tool for analyzing and comparing page performance. By following the steps and techniques outlined in this guide, you can gain valuable insights into user behavior, identify areas for improvement, and make data-driven decisions to optimize your website.
Remember to define clear objectives, use relevant metrics, combine comparisons with segments, and regularly review your analyses to stay informed and adapt to changes in your website and user behavior.
Ready to dive deeper and make more informed decisions? Visit COMPARE.EDU.VN today to explore more detailed comparisons and discover the insights you need to optimize your website and marketing strategies! Our expert analyses and comprehensive comparisons will help you navigate the complexities of data and make confident choices.
Contact Us:
- Address: 333 Comparison Plaza, Choice City, CA 90210, United States
- WhatsApp: +1 (626) 555-9090
- Website: compare.edu.vn
