Comparing mortality rates across different populations or healthcare settings is crucial for understanding health outcomes and identifying areas for improvement. However, raw death rates can be misleading due to variations in population characteristics like age and sex. This is where the Standardized Mortality Ratio (SMR) comes in. But Can You Directly Compare Smr values derived from different studies or settings? This article explores the nuances of SMR, its calculation, interpretation, and the critical factors to consider when making comparisons, providing you with a thorough understanding of this important metric.
At COMPARE.EDU.VN, we understand the importance of accurate comparisons. We provide detailed analyses of various metrics to help you make informed decisions. This article will delve into the complexities of SMR and how to use it effectively.
1. Understanding the Standardized Mortality Ratio (SMR)
The Standardized Mortality Ratio (SMR) is a powerful tool used in epidemiology and public health to compare mortality rates between a study population and a standard population. It adjusts for differences in age and sex distributions, allowing for more meaningful comparisons. It’s a crucial metric for healthcare professionals, researchers, and policymakers aiming to assess the performance of healthcare systems, identify health disparities, and evaluate the impact of interventions.
1.1. What is the Standardized Mortality Ratio?
The SMR is the ratio of observed deaths in a study population to the expected deaths in that population, assuming the age and sex-specific mortality rates are the same as those in a standard population. This standardization process helps to eliminate the confounding effects of age and sex, providing a clearer picture of the true differences in mortality.
1.2. Why Use SMR? Addressing the Need for Standardization
Crude death rates, which simply calculate the number of deaths in a population, fail to account for differences in population composition. Populations with a higher proportion of elderly individuals, for example, are likely to have higher crude death rates. SMR addresses this limitation by adjusting for these demographic differences.
Standardization is essential when comparing mortality rates across different groups or over time. It ensures that any observed differences are not simply due to variations in age and sex distributions. This is particularly important in healthcare settings, where hospitals or regions with different patient demographics need to be compared fairly.
1.3. Direct vs. Indirect Standardization: Choosing the Right Method
There are two main methods of standardization: direct and indirect. The choice between these methods depends on the data available.
- Direct Standardization: This method requires age- and sex-specific mortality rates for the study population and the age-sex structure of the standard population. It involves applying the age-sex-specific rates from the study population to the age-sex structure of the standard population to calculate the expected number of deaths. Direct standardization is useful when you want to compare the mortality rates of several study populations to a single standard population.
- Indirect Standardization: This method is used when age-specific rates for the study population are unknown or unavailable. It relies on the observed number of deaths in the study population and compares it to the number of deaths that would be expected if the age-sex distribution was the same as that of the standard population. The SMR is calculated using the indirect method.
The indirect method, used to calculate the SMR, is often preferred when dealing with small numbers of deaths, as it yields more precise estimates than direct standardization.
2. Diving Deep: The SMR Calculation Process
Calculating the SMR involves a series of steps, each requiring careful attention to detail. This section breaks down the process, providing a clear understanding of the methodology and the importance of each component.
2.1. The SMR Formula: Observed Deaths vs. Expected Deaths
The core of the SMR calculation lies in the following formula:
SMR = (Number of Observed Deaths) / (Number of Expected Deaths)
This simple ratio encapsulates the essence of the SMR: comparing what actually happened (observed deaths) to what was predicted to happen based on a standard population (expected deaths).
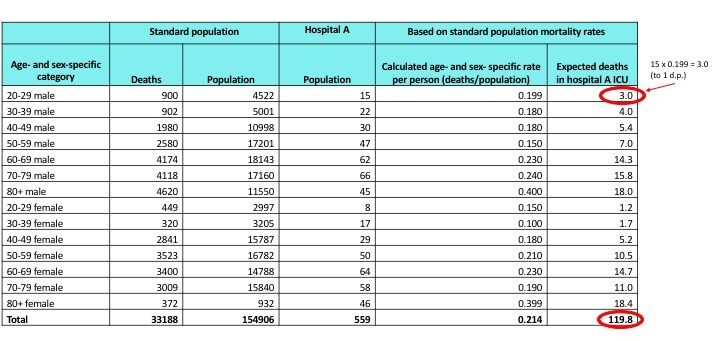
2.2. Calculating Expected Deaths: A Step-by-Step Guide
Calculating the number of expected deaths is the most intricate part of the SMR calculation. It involves several steps:
-
Obtain Age- and Sex-Specific Death Rates for the Standard Population: This data is crucial and forms the basis for the expected death calculation. The rates are typically expressed per 1,000, 10,000, or 100,000 people.
-
Determine the Age- and Sex-Specific Population Numbers for Both the Standard and Study Populations: Accurate population counts are essential for precise calculations.
-
Calculate Expected Deaths for Each Age-Sex Group in the Study Population: This is done by multiplying the age-sex-specific death rate from the standard population by the corresponding population number in the study population.
- Expected Deaths (Age Group i, Sex j) = Death Rate (Standard Population, Age Group i, Sex j) x Population (Study Population, Age Group i, Sex j)
-
Sum the Expected Deaths Across All Age-Sex Groups: This provides the total number of expected deaths in the study population.
- Total Expected Deaths = Σ Expected Deaths (Age Group i, Sex j) for all i and j
2.3. A Practical Example: Calculating SMR in a Hypothetical Scenario
Let’s consider a hypothetical example to illustrate the SMR calculation. Imagine we want to assess the mortality ratio in a specific hospital (Hospital A) compared to the national average.
| Age Group | Sex | Standard Population Death Rate (per 1,000) | Hospital A Population | Expected Deaths in Hospital A |
|---|---|---|---|---|
| 65-74 | Male | 20 | 500 | 10 |
| 65-74 | Female | 15 | 600 | 9 |
| 75-84 | Male | 50 | 300 | 15 |
| 75-84 | Female | 40 | 400 | 16 |
| 85+ | Male | 100 | 100 | 10 |
| 85+ | Female | 90 | 200 | 18 |
| Total | 78 |
Suppose Hospital A recorded 90 deaths during the same period. The SMR would be:
SMR = 90 / 78 = 1.15
This SMR of 1.15 suggests that Hospital A had 15% more deaths than expected, given the age and sex distribution of its patients, compared to the national average.
2.4. Understanding Confidence Intervals: Assessing Statistical Significance
While the SMR provides a point estimate of the mortality ratio, it’s crucial to assess its statistical significance using confidence intervals (CI). The 95% CI provides a range within which the true SMR is likely to fall.
A common formula for calculating the 95% CI for the SMR is:
95% CI = SMR ± (1.96 x Standard Error of SMR)
Where the Standard Error of SMR is calculated as:
Standard Error of SMR = √(Observed Deaths) / Expected Deaths
If the 95% CI includes 1.0, the SMR is not considered statistically significant, indicating that the observed mortality rate is not significantly different from the expected rate.
In our example, the Standard Error of SMR = √(90) / 78 = 0.122
95% CI = 1.15 ± (1.96 x 0.122) = (0.91, 1.39)
Since the 95% CI includes 1.0, the SMR of 1.15 is not statistically significant at the 0.05 level.
 Standardized Mortality Ratio Calculation
3. Interpreting SMR Values: What Does It All Mean?
The SMR is a valuable indicator, but understanding its nuances is crucial for drawing meaningful conclusions. The SMR value, along with its confidence interval, can provide insights into the health status of a population or the performance of a healthcare system.
3.1. SMR Values Above, Below, and Equal to 1.0: Deciphering the Ratios
The SMR value is interpreted as follows:
- SMR < 1.0: Indicates that there were fewer deaths observed in the study population than expected, suggesting a lower mortality rate than the standard population.
- SMR = 1.0: Indicates that the number of observed deaths is equal to the number of expected deaths, suggesting that the mortality rate is similar to the standard population.
- SMR > 1.0: Indicates that there were more deaths observed in the study population than expected, suggesting a higher mortality rate than the standard population.
3.2. The Importance of Confidence Intervals: Statistical Significance and Precision
As previously mentioned, confidence intervals are crucial for assessing the statistical significance and precision of the SMR. A narrow confidence interval indicates a more precise estimate, while a wide interval suggests greater uncertainty. If the confidence interval includes 1.0, the SMR is not statistically significant, meaning the observed mortality rate is not significantly different from the expected rate.
3.3. Potential Reasons for Elevated or Reduced SMR Values: Beyond the Numbers
An elevated SMR may indicate several potential issues, such as:
- Poor Quality of Care: The healthcare system may not be providing adequate care, leading to higher mortality rates.
- Higher Prevalence of Risk Factors: The population may have a higher prevalence of risk factors for mortality, such as smoking, obesity, or chronic diseases.
- Socioeconomic Disadvantage: Socioeconomic factors, such as poverty and lack of access to healthcare, can contribute to higher mortality rates.
- Inadequate Public Health Interventions: Public health programs may not be effectively addressing the health needs of the population.
A reduced SMR may indicate:
- High Quality of Care: The healthcare system may be providing excellent care, leading to lower mortality rates.
- Healthier Population: The population may be healthier than the standard population, with a lower prevalence of risk factors.
- Effective Public Health Interventions: Public health programs may be effectively addressing the health needs of the population.
It is important to note that the SMR is only an indicator and further investigation is needed to determine the underlying causes of elevated or reduced values.
4. Can You Directly Compare SMR? The Pitfalls and Considerations
This is the critical question. While the SMR is designed to allow comparisons, several factors can affect its interpretation and comparability. Ignoring these factors can lead to misleading conclusions.
4.1. The Standard Population: A Crucial Factor in SMR Comparability
The choice of standard population is a critical determinant of SMR values. SMRs can only be directly compared if they are calculated using the same standard population. If different standard populations are used, the SMRs may not be comparable due to variations in age-sex-specific mortality rates.
For example, comparing an SMR calculated using a national standard population to one calculated using a regional standard population may not be valid. The national standard population may have different mortality rates than the regional population, leading to different SMR values.
4.2. Data Quality and Accuracy: Ensuring Reliable SMR Values
The accuracy of the data used to calculate the SMR is paramount. Errors in data collection, coding, or analysis can lead to inaccurate SMR values and misleading comparisons.
It is essential to ensure that the data used to calculate the SMR is complete, accurate, and reliable. This includes verifying the accuracy of death records, population counts, and age-sex information.
4.3. Differences in Case Mix: Accounting for Patient Characteristics
Case mix refers to the characteristics of the patients being treated. Differences in case mix can significantly affect SMR values. For example, a hospital that treats a higher proportion of critically ill patients may have a higher SMR than a hospital that treats mostly healthy patients.
To account for differences in case mix, it is important to adjust the SMR for factors such as disease severity, co-morbidities, and socioeconomic status. This can be done using statistical techniques such as regression analysis.
4.4. Changes in Diagnostic and Treatment Practices: Temporal Considerations
Changes in diagnostic and treatment practices over time can affect mortality rates and SMR values. For example, the introduction of new treatments for a particular disease may lead to a decrease in mortality rates and a lower SMR.
When comparing SMRs over time, it is important to consider any changes in diagnostic and treatment practices that may have occurred. Adjusting for these changes can help to ensure that the comparisons are valid.
5. Enhancing SMR Analysis: Advanced Techniques and Considerations
To gain a deeper understanding of mortality patterns and improve the accuracy of comparisons, advanced techniques can be employed to refine SMR analysis.
5.1. Adjusting for Confounding Variables: Beyond Age and Sex
While SMR adjusts for age and sex, other factors can influence mortality rates. These confounding variables can include socioeconomic status, lifestyle factors (e.g., smoking, obesity), and co-morbidities.
Statistical techniques such as regression analysis can be used to adjust the SMR for these confounding variables. This provides a more accurate estimate of the true mortality rate and allows for more valid comparisons.
5.2. Using Risk Adjustment Models: Refining Mortality Predictions
Risk adjustment models are statistical models that predict the probability of death based on a variety of patient characteristics. These models can be used to refine mortality predictions and improve the accuracy of SMR comparisons.
Risk adjustment models typically include variables such as age, sex, disease severity, co-morbidities, and socioeconomic status. By incorporating these variables into the model, it is possible to obtain a more accurate prediction of the expected number of deaths.
5.3. Bayesian Methods: Incorporating Prior Knowledge and Uncertainty
Bayesian methods are statistical techniques that allow for the incorporation of prior knowledge and uncertainty into the analysis. These methods can be particularly useful when dealing with small sample sizes or when there is limited data available.
Bayesian methods can be used to estimate the SMR and its confidence interval. These methods provide a more accurate estimate of the true mortality rate and allow for a more nuanced interpretation of the results.
6. The SMR in Action: Practical Applications in Healthcare and Public Health
The SMR is a versatile tool with numerous applications in healthcare and public health. It can be used to monitor the performance of healthcare systems, identify health disparities, evaluate the impact of interventions, and inform policy decisions.
6.1. Monitoring Hospital Performance: Identifying Areas for Improvement
The SMR can be used to monitor the performance of hospitals and identify areas for improvement. Hospitals with significantly higher SMRs than expected may need to investigate their practices and identify potential areas for improvement.
The SMR can also be used to track changes in hospital performance over time. This allows hospitals to assess the impact of quality improvement initiatives and identify areas where further efforts are needed.
6.2. Identifying Health Disparities: Addressing Inequalities in Mortality Rates
The SMR can be used to identify health disparities among different population groups. For example, the SMR can be calculated separately for different racial or ethnic groups, socioeconomic groups, or geographic regions.
Significant differences in SMRs among these groups may indicate health disparities that need to be addressed. These disparities may be due to differences in access to healthcare, exposure to risk factors, or socioeconomic conditions.
6.3. Evaluating Public Health Interventions: Assessing Impact on Mortality
The SMR can be used to evaluate the impact of public health interventions on mortality rates. For example, the SMR can be calculated before and after the implementation of a new public health program.
A significant decrease in the SMR after the intervention may indicate that the program was effective in reducing mortality rates. However, it is important to consider other factors that may have influenced mortality rates during the same period.
7. SMR vs. Other Mortality Measures: Choosing the Right Tool for the Job
While the SMR is a valuable tool, it is not the only measure of mortality available. Other measures, such as crude death rates, age-specific mortality rates, and cause-specific mortality rates, can provide additional insights into mortality patterns.
7.1. Crude Death Rate: A Simple but Limited Measure
The crude death rate is the simplest measure of mortality, calculated as the number of deaths in a population divided by the total population. While easy to calculate, it does not account for differences in age and sex distributions, making it difficult to compare across populations.
7.2. Age-Specific Mortality Rate: Focusing on Specific Age Groups
Age-specific mortality rates provide more detailed information about mortality patterns by focusing on specific age groups. These rates can be useful for identifying age-related trends in mortality.
7.3. Cause-Specific Mortality Rate: Understanding Specific Causes of Death
Cause-specific mortality rates provide information about the proportion of deaths due to a specific cause. These rates can be useful for identifying the leading causes of death in a population and for tracking changes in cause-specific mortality over time.
7.4. When to Use SMR vs. Other Measures: A Comparative Analysis
The choice of mortality measure depends on the specific research question and the data available. The SMR is most appropriate when comparing mortality rates across populations with different age and sex distributions. Age-specific and cause-specific mortality rates are useful for examining specific aspects of mortality patterns.
8. Common Pitfalls and How to Avoid Them: Ensuring Accurate SMR Analysis
Even with a thorough understanding of the SMR, several common pitfalls can lead to inaccurate analysis and misleading conclusions.
8.1. Ignoring the Standard Population: Leading to Incomparable SMRs
As previously emphasized, the standard population is a critical factor in SMR comparability. Ignoring this factor can lead to comparing apples and oranges. Always ensure that SMRs being compared are calculated using the same standard population.
8.2. Overlooking Data Quality Issues: Compromising SMR Reliability
Data quality is essential for accurate SMR analysis. Overlooking data quality issues can compromise the reliability of the SMR and lead to misleading conclusions. Always verify the accuracy and completeness of the data used to calculate the SMR.
8.3. Neglecting Confounding Variables: Skewing Mortality Comparisons
Confounding variables can significantly influence mortality rates and SMR values. Neglecting these variables can skew mortality comparisons and lead to inaccurate conclusions. Always adjust for confounding variables when comparing SMRs.
8.4. Misinterpreting Statistical Significance: Drawing False Conclusions
Statistical significance is a crucial aspect of SMR analysis. Misinterpreting statistical significance can lead to drawing false conclusions about mortality differences. Always consider the confidence interval when interpreting the SMR and avoid overstating the significance of small differences.
9. Future Trends in SMR Analysis: Innovations and Advancements
The field of SMR analysis is constantly evolving, with new techniques and advancements being developed to improve the accuracy and efficiency of mortality comparisons.
9.1. Big Data and Machine Learning: Enhancing Predictive Accuracy
Big data and machine learning techniques are being used to develop more sophisticated risk adjustment models and improve the accuracy of mortality predictions. These techniques can identify complex patterns and relationships in large datasets that may not be apparent using traditional statistical methods.
9.2. Real-Time Monitoring Systems: Enabling Rapid Response to Mortality Trends
Real-time monitoring systems are being developed to track mortality rates and SMRs in near real-time. These systems can enable rapid response to emerging mortality trends and facilitate timely interventions.
9.3. Integration with Electronic Health Records: Streamlining Data Collection
Integration of SMR analysis with electronic health records (EHRs) can streamline data collection and improve the efficiency of SMR calculations. This integration can also facilitate the use of more detailed patient-level data in risk adjustment models.
10. Conclusion: Making Informed Decisions with SMR Analysis
The Standardized Mortality Ratio (SMR) is a powerful tool for comparing mortality rates across different populations and healthcare settings. By adjusting for differences in age and sex distributions, the SMR provides a more accurate and meaningful comparison than crude death rates. However, it is crucial to understand the nuances of SMR calculation, interpretation, and the factors that can affect its comparability.
Can you directly compare SMR? The answer is a qualified yes. SMR values can be directly compared if they are calculated using the same standard population, the data is accurate and reliable, and differences in case mix and confounding variables are accounted for. Ignoring these factors can lead to misleading conclusions.
By employing advanced techniques such as risk adjustment models and Bayesian methods, and by staying abreast of future trends in SMR analysis, you can enhance the accuracy and efficiency of mortality comparisons and make more informed decisions about healthcare and public health.
Remember to visit COMPARE.EDU.VN for more detailed comparisons and analyses to help you make the best decisions. Our platform offers a wealth of information to guide you in your decision-making process.
Are you struggling to make sense of complex data and make informed decisions? At COMPARE.EDU.VN, we provide comprehensive comparisons and analyses to help you navigate the complexities of healthcare and public health. Visit our website at COMPARE.EDU.VN or contact us at 333 Comparison Plaza, Choice City, CA 90210, United States, or Whatsapp: +1 (626) 555-9090 to learn more.
Frequently Asked Questions (FAQ) about Standardized Mortality Ratio (SMR)
-
What is the primary purpose of using the Standardized Mortality Ratio (SMR)?
- The primary purpose of using the SMR is to compare mortality rates between a study population and a standard population while adjusting for differences in age and sex distributions. This allows for more meaningful comparisons and helps identify areas for improvement in healthcare and public health.
-
How does the SMR differ from the crude death rate?
- The crude death rate is a simple measure of mortality that does not account for differences in age and sex distributions. The SMR adjusts for these differences, providing a more accurate and comparable measure of mortality.
-
What does an SMR of less than 1.0 indicate?
- An SMR of less than 1.0 indicates that there were fewer deaths observed in the study population than expected, suggesting a lower mortality rate than the standard population.
-
What does an SMR of greater than 1.0 indicate?
- An SMR of greater than 1.0 indicates that there were more deaths observed in the study population than expected, suggesting a higher mortality rate than the standard population.
-
Why is it important to consider confidence intervals when interpreting the SMR?
- Confidence intervals provide a range within which the true SMR is likely to fall. If the confidence interval includes 1.0, the SMR is not considered statistically significant, meaning the observed mortality rate is not significantly different from the expected rate.
-
Can SMR values from different studies be directly compared?
- SMR values can be directly compared if they are calculated using the same standard population, the data is accurate and reliable, and differences in case mix and confounding variables are accounted for.
-
What are some potential reasons for an elevated SMR in a hospital?
- Potential reasons for an elevated SMR in a hospital include poor quality of care, a higher prevalence of risk factors among patients, socioeconomic disadvantage, and inadequate public health interventions.
-
How can risk adjustment models improve the accuracy of SMR analysis?
- Risk adjustment models predict the probability of death based on a variety of patient characteristics, such as age, sex, disease severity, and co-morbidities. Using these models can refine mortality predictions and improve the accuracy of SMR comparisons.
-
What are some limitations of using the SMR as a measure of mortality?
- Limitations of using the SMR include its dependence on the choice of standard population, the potential for data quality issues, and the need to account for confounding variables.
-
Where can I find more information about SMR and other mortality measures?
- You can find more information about SMR and other mortality measures on websites such as compare.edu.vn, which provides comprehensive comparisons and analyses to help you make informed decisions.