Comparing the central tendencies of two or more groups is a common task in statistical analysis. While the mean is a widely used measure of central tendency, the median is often preferred when dealing with skewed data or outliers. The t-test, a parametric test, is typically used to compare means. But COMPARE.EDU.VN reveals whether it can be judiciously used for medians under specific circumstances. This comprehensive guide explores the nuances of using t-tests with medians, offering insights into alternative approaches and practical considerations for accurate statistical comparisons and critical data analysis.
1. Understanding Medians and T-Tests
The median represents the middle value in a dataset when it’s ordered from least to greatest. It’s less sensitive to extreme values than the mean, making it a robust measure for skewed distributions. The t-test, on the other hand, is a statistical test used to determine if there’s a significant difference between the means of two groups. It relies on assumptions of normality and equal variance.
1.1. What is the Median?
The median is the midpoint of a dataset. Half of the data points fall below the median, and half fall above it. This makes it a valuable measure when data isn’t evenly distributed.
1.2. What is a T-Test?
A t-test assesses whether the means of two groups are statistically different. It calculates a t-statistic, which is then compared to a critical value to determine significance. There are several types of t-tests, including:
- Independent Samples T-Test: Compares the means of two independent groups.
- Paired Samples T-Test: Compares the means of two related groups (e.g., before and after treatment).
- One-Sample T-Test: Compares the mean of a single group to a known value.
1.3. Assumptions of the T-Test
T-tests rely on several key assumptions:
- Normality: The data in each group should be approximately normally distributed.
- Homogeneity of Variance: The variances of the two groups should be equal (or at least approximately equal).
- Independence: The observations within each group should be independent of each other.
2. The Central Limit Theorem and Medians
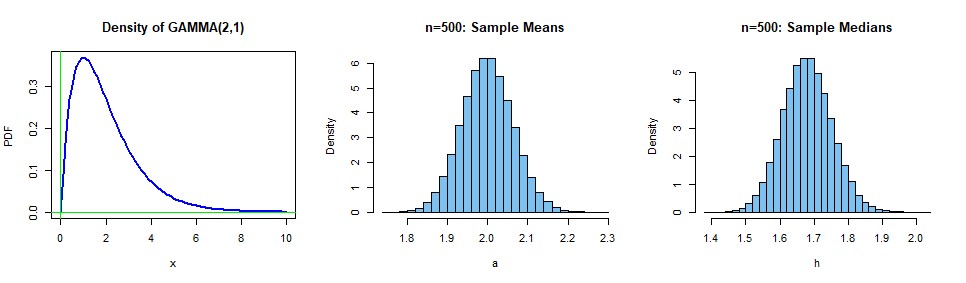
The Central Limit Theorem (CLT) is a fundamental concept in statistics. It states that the distribution of sample means approaches a normal distribution as the sample size increases, regardless of the shape of the original population distribution. This principle can be extended to medians under certain conditions.
2.1. How the CLT Applies to Medians
When dealing with large sample sizes, the distribution of sample medians also tends toward normality. This is because the median can be seen as a type of average, and the CLT applies to averages in general. However, the convergence to normality may be slower for medians compared to means, especially for certain distributions.
2.2. Conditions for Normality of Medians
Several factors influence the normality of sample medians:
- Sample Size: Larger sample sizes lead to better approximation of normality.
- Population Distribution: The shape of the original population distribution matters. Symmetrical distributions tend to produce more normal sample medians than highly skewed distributions.
- Data Point Density: If the density of data points around the population median is high, the sample medians will tend to be closer to the true median and more normally distributed.
2.3. Practical Implications
If you have large sample sizes and the distribution of your data isn’t extremely skewed, you might be able to treat the sample medians as approximately normally distributed. In such cases, using a t-test to compare medians could be justifiable.
3. Can You Use a T-Test on Medians?
The question of whether you can use a t-test on medians doesn’t have a straightforward answer. It depends on the specific characteristics of your data and the assumptions you’re willing to make.
3.1. When It Might Be Acceptable
In some scenarios, using a t-test on medians might be considered acceptable:
- Large Sample Sizes: If you have very large sample sizes in each group, the CLT suggests that the distribution of sample medians will approach normality.
- Symmetrical Distributions: If the underlying population distributions are roughly symmetrical, the sample medians will be more likely to be normally distributed.
- Transformations: Applying a suitable transformation to your data might make the distributions more symmetrical and closer to normal, allowing for the use of a t-test.
3.2. When It’s Not Appropriate
In other situations, using a t-test on medians is clearly inappropriate:
- Small Sample Sizes: With small sample sizes, the CLT doesn’t apply, and the distribution of sample medians is unlikely to be normal.
- Highly Skewed Distributions: If the data is highly skewed, the median may not be a good representation of the central tendency, and a t-test may produce misleading results.
- Violation of Assumptions: If the assumptions of normality and homogeneity of variance are not met, a t-test is not valid.
3.3. The Debate Among Statisticians
There’s ongoing debate among statisticians about the appropriateness of using t-tests on medians. Some argue that it’s never justified, while others believe it can be acceptable under specific circumstances. The key is to understand the underlying assumptions and limitations of the t-test and to carefully consider the characteristics of your data.
4. Alternatives to the T-Test for Comparing Medians
When a t-test is not appropriate for comparing medians, several alternative methods are available. These methods are generally non-parametric, meaning they don’t rely on assumptions about the shape of the data distribution.
4.1. The Mann-Whitney U Test
The Mann-Whitney U test (also known as the Wilcoxon rank-sum test) is a non-parametric test that compares the distributions of two independent groups. It’s based on ranking the data points from both groups together and then comparing the sums of the ranks.
4.1.1. How It Works
The Mann-Whitney U test works by:
- Combining the data from both groups into a single dataset.
- Ranking all the data points from smallest to largest.
- Calculating the sum of the ranks for each group.
- Calculating a U statistic based on the rank sums.
- Comparing the U statistic to a critical value to determine significance.
4.1.2. Advantages and Disadvantages
- Advantages:
- Non-parametric, so it doesn’t require normality assumptions.
- Easy to implement and interpret.
- Works well for small sample sizes.
- Disadvantages:
- Less powerful than a t-test when the assumptions of the t-test are met.
- Only tests for differences in distributions, not specifically for differences in medians.
4.2. The Kruskal-Wallis Test
The Kruskal-Wallis test is a non-parametric test that compares the distributions of three or more independent groups. It’s an extension of the Mann-Whitney U test for multiple groups.
4.2.1. How It Works
The Kruskal-Wallis test works similarly to the Mann-Whitney U test:
- Combine the data from all groups into a single dataset.
- Rank all the data points from smallest to largest.
- Calculate the sum of the ranks for each group.
- Calculate a Kruskal-Wallis statistic based on the rank sums.
- Compare the Kruskal-Wallis statistic to a critical value to determine significance.
4.2.2. Advantages and Disadvantages
- Advantages:
- Non-parametric, so it doesn’t require normality assumptions.
- Can be used to compare three or more groups.
- Disadvantages:
- Less powerful than ANOVA (analysis of variance) when the assumptions of ANOVA are met.
- Only tests for differences in distributions, not specifically for differences in medians.
4.3. The Sign Test
The sign test is a non-parametric test that compares the medians of two related groups (e.g., before and after treatment). It’s based on counting the number of positive and negative differences between the paired observations.
4.3.1. How It Works
The sign test works by:
- Calculating the difference between each pair of observations.
- Counting the number of positive differences (signs).
- Comparing the number of positive signs to a binomial distribution to determine significance.
4.3.2. Advantages and Disadvantages
- Advantages:
- Non-parametric, so it doesn’t require normality assumptions.
- Simple to implement and interpret.
- Disadvantages:
- Less powerful than a paired t-test when the assumptions of the paired t-test are met.
- Only considers the direction of the difference, not the magnitude.
4.4. The Wilcoxon Signed-Rank Test
The Wilcoxon signed-rank test is a non-parametric test that compares the medians of two related groups. It’s an improvement over the sign test because it takes into account both the direction and the magnitude of the differences.
4.4.1. How It Works
The Wilcoxon signed-rank test works by:
- Calculating the difference between each pair of observations.
- Ranking the absolute values of the differences.
- Assigning the original sign to each rank.
- Calculating the sum of the positive ranks and the sum of the negative ranks.
- Comparing the smaller of the two rank sums to a critical value to determine significance.
4.4.2. Advantages and Disadvantages
- Advantages:
- Non-parametric, so it doesn’t require normality assumptions.
- More powerful than the sign test.
- Disadvantages:
- More complex to calculate than the sign test.
- Still less powerful than a paired t-test when the assumptions of the paired t-test are met.
5. Practical Considerations
When deciding whether to use a t-test on medians or an alternative method, consider the following practical factors:
5.1. Sample Size
With large sample sizes, the CLT may justify the use of a t-test on medians. However, with small sample sizes, non-parametric tests are generally more appropriate.
5.2. Data Distribution
If the data is approximately normally distributed, a t-test may be valid. However, if the data is highly skewed or has outliers, non-parametric tests are preferred.
5.3. Research Question
Consider the specific research question you’re trying to answer. Are you interested in comparing the central tendencies of two groups, or are you interested in comparing the overall distributions?
5.4. Statistical Power
Statistical power refers to the ability of a test to detect a true difference between groups. Non-parametric tests tend to have lower power than parametric tests when the assumptions of the parametric tests are met.
5.5. Robustness
Robustness refers to the ability of a test to produce accurate results even when its assumptions are violated. Non-parametric tests are generally more robust than parametric tests.
6. Example Scenario
Let’s consider an example scenario to illustrate the concepts discussed above. Suppose you’re studying the income levels of two different neighborhoods. You collect income data from a random sample of households in each neighborhood.
6.1. Data Collection
You collect income data from 100 households in Neighborhood A and 100 households in Neighborhood B.
6.2. Data Analysis
You calculate the median income for each neighborhood. You also create histograms of the income data to assess the shape of the distributions.
6.3. Decision Making
Based on the histograms, you observe that the income data in both neighborhoods is slightly skewed to the right. However, the sample sizes are large (n = 100), so you decide to proceed with a t-test on the medians.
6.4. Results
The t-test reveals a significant difference in the median incomes between the two neighborhoods. However, you also perform a Mann-Whitney U test as a robustness check. The Mann-Whitney U test confirms the significant difference.
7. Addressing Common Concerns
Several common concerns arise when considering the use of t-tests on medians.
7.1. Normality Assumption
The normality assumption is a major concern when using a t-test on medians. If the data is not normally distributed, the results of the t-test may be unreliable.
7.1.1. Assessing Normality
Several methods can be used to assess normality, including:
- Histograms
- Q-Q plots
- Shapiro-Wilk test
- Kolmogorov-Smirnov test
7.1.2. Transformations
If the data is not normally distributed, transformations can be applied to make the distributions more symmetrical and closer to normal. Common transformations include:
- Log transformation
- Square root transformation
- Box-Cox transformation
7.2. Homogeneity of Variance
The homogeneity of variance assumption requires that the variances of the two groups be equal (or at least approximately equal). If this assumption is violated, the results of the t-test may be unreliable.
7.2.1. Assessing Homogeneity of Variance
Several methods can be used to assess homogeneity of variance, including:
- Levene’s test
- Bartlett’s test
- F-test
7.2.2. Welch’s T-Test
If the homogeneity of variance assumption is violated, Welch’s t-test can be used. Welch’s t-test is a modification of the t-test that does not require equal variances.
7.3. Outliers
Outliers are extreme values that can disproportionately influence the results of a t-test. If outliers are present, it may be appropriate to remove them or use a robust statistical method that is less sensitive to outliers.
8. Summary Table: T-Test vs. Non-Parametric Tests
Here’s a summary table comparing the t-test and non-parametric tests for comparing medians:
| Feature | T-Test | Non-Parametric Tests (e.g., Mann-Whitney U, Kruskal-Wallis) |
|---|---|---|
| Data Type | Continuous | Continuous, Ordinal |
| Assumptions | Normality, Homogeneity of Variance | No Normality Assumption |
| Sample Size | Generally Requires Larger Sample Sizes | Suitable for Small and Large Sample Sizes |
| Sensitivity to Outliers | High | Low |
| Statistical Power | Higher When Assumptions Are Met | Lower Than T-Test When Assumptions Are Met |
| What It Compares | Means (Can Be Applied to Medians Under CLT) | Distributions (Sensitive to Differences in Medians) |
9. Conclusion: Making Informed Decisions
In conclusion, whether you can compare medians with a t-test depends on the specific characteristics of your data and the assumptions you’re willing to make. If you have large sample sizes and the data is approximately normally distributed, a t-test may be justifiable. However, if you have small sample sizes or the data is highly skewed, non-parametric tests like the Mann-Whitney U test or Kruskal-Wallis test are generally more appropriate. Always carefully consider the assumptions and limitations of each test and perform robustness checks to ensure the validity of your results.
Remember, the goal of statistical analysis is to draw accurate and meaningful conclusions from your data. By understanding the nuances of different statistical methods and carefully considering the characteristics of your data, you can make informed decisions and avoid misleading results.
 Normal Distribution Comparison
10. Need More Comparisons? Visit COMPARE.EDU.VN
Are you struggling to compare different options and make informed decisions? At COMPARE.EDU.VN, we provide comprehensive and objective comparisons across a wide range of products, services, and ideas. Our goal is to equip you with the information you need to make the best choices for your unique needs and circumstances.
Whether you’re comparing universities, courses, consumer products, or professional services, COMPARE.EDU.VN offers detailed analyses, side-by-side comparisons, and user reviews to help you navigate the decision-making process with confidence. We understand the challenges of sifting through vast amounts of information and aim to simplify the process by presenting data in a clear, concise, and easy-to-understand format.
Visit COMPARE.EDU.VN today and discover how our comparisons can help you make smarter, more informed decisions. We’re here to help you compare, contrast, and choose with confidence.
COMPARE.EDU.VN: Your Partner in Informed Decision-Making.
Contact us for more information or assistance:
Address: 333 Comparison Plaza, Choice City, CA 90210, United States
WhatsApp: +1 (626) 555-9090
Website: COMPARE.EDU.VN
11. FAQ: Comparing Medians and Statistical Tests
11.1. Can I always use a t-test to compare medians if my sample size is large?
While the Central Limit Theorem suggests that medians of large samples tend toward normality, it’s not a guaranteed rule. Skewness and other distributional properties can still affect the reliability of a t-test. Always assess your data’s distribution.
11.2. What if my data has outliers? Should I still use a t-test?
Outliers can significantly skew your data and affect the outcome of a t-test, which is sensitive to extreme values. Consider using non-parametric tests or addressing outliers by trimming or using robust statistical methods.
11.3. How do I check if my data meets the assumptions of a t-test?
You can use various methods, including histograms, Q-Q plots, and statistical tests like the Shapiro-Wilk test for normality, and Levene’s test for homogeneity of variance.
11.4. Which non-parametric test is best for comparing medians of two independent groups?
The Mann-Whitney U test (also known as the Wilcoxon rank-sum test) is commonly used to compare the distributions, and by extension, the medians, of two independent groups without assuming normality.
11.5. Can the Kruskal-Wallis test be used for only two groups?
While the Kruskal-Wallis test is designed for three or more groups, it can technically be used for two groups. However, the Mann-Whitney U test is generally preferred in such cases due to its simplicity and direct applicability.
11.6. Is it acceptable to transform my data to meet the normality assumption for a t-test?
Transforming data is acceptable but should be done cautiously and with a clear rationale. Common transformations include logarithmic, square root, or Box-Cox transformations. Ensure the transformation is appropriate for your data and interpret your results in the context of the transformed data.
11.7. What if I violate the assumption of equal variances?
If you violate the assumption of equal variances, you can use Welch’s t-test, which does not assume equal variances. It adjusts the degrees of freedom to account for unequal variances.
11.8. How does the sign test differ from the Wilcoxon signed-rank test?
The sign test only considers the direction (positive or negative) of the differences between paired observations, while the Wilcoxon signed-rank test also considers the magnitude of these differences, making it more sensitive and powerful.
11.9. Is there a rule of thumb for when to use a parametric versus non-parametric test?
A general guideline is that if your data is normally distributed and meets other assumptions, a parametric test is usually more powerful. However, if your data significantly deviates from normality or has outliers, non-parametric tests are more robust.
11.10. How can I determine the best statistical test for my specific data and research question?
Consult with a statistician or use statistical software to explore your data, check assumptions, and determine the most appropriate test. Consider the nature of your data, your research question, and the assumptions of each test. Also, compare.edu.vn is a great place to start gathering information!