Comparing protein expression across different western blots is crucial for accurate data interpretation. This involves analyzing band intensities and normalizing them to account for variations in experimental conditions. This article provides a comprehensive guide on using ImageJ, a free image processing software, to quantify and compare bands between gels.
Understanding Western Blot Analysis and ImageJ
Western blotting is a technique used to detect specific proteins in a sample. After separating proteins by size using gel electrophoresis, they are transferred to a membrane and probed with antibodies. The resulting bands are visualized and their intensities reflect the relative abundance of the target protein.
ImageJ offers powerful tools for analyzing western blot images. Its gel analysis features allow for precise quantification of band intensities, enabling researchers to compare protein expression levels across different samples and even different gels.
Comparing Bands: A Step-by-Step Guide with ImageJ
1. Image Preparation:
- Open your western blot image in ImageJ (File > Open).
- Convert the image to 8-bit grayscale (Image > Type > 8-bit). This ensures the analysis focuses on band intensity.
2. Lane Selection:
- Using the Rectangular Selections tool, draw a rectangle around the first lane, ensuring the rectangle is taller than it is wide to indicate vertical lanes.
- Press “1” or (Command + 1 on Mac) to set the first lane.
- Drag the rectangle to the next lane and press “2” (Command + 2 on Mac) to set the second lane. Repeat for all lanes.
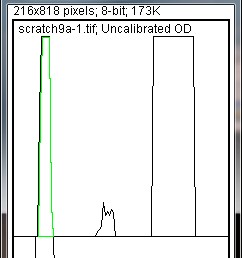
3. Generating a Profile Plot:
- After selecting all lanes, press “3” (Command + 3 on Mac) or go to Analyze > Gels > Plot Lanes.
- This generates a profile plot, where peaks represent bands and peak heights correspond to band intensities. Higher peaks indicate darker, more intense bands.
4. Defining Peaks and Background Correction:
- Use the Straight Line tool to draw a baseline across the bottom of each peak to separate it from background noise. This step requires careful judgment to accurately define the peak area.
- Use the Wand tool to click inside each peak you want to analyze. This highlights the peak and generates measurements in the Results window.
5. Data Output and Analysis:
- Go to Analyze > Gels > Label Peaks to label each peak with its percentage of the total area.
- Copy the data from the Results window (Edit > Copy All) and paste it into a spreadsheet.
- Calculate the relative density of each band by normalizing it to a standard band on the same blot (e.g., a loading control or a known standard). This accounts for variations in loading and blotting efficiency. Divide each band’s intensity by the standard band’s intensity.
Comparing Bands Across Multiple Gels
To compare bands across multiple gels, include the same standard sample on each gel. This allows normalization to a common reference point, accounting for variations in antibody activity, exposure times, or other experimental conditions between blots.
Normalization:
- Analyze each gel individually using the steps outlined above.
- Normalize the relative density of each band on each gel to the relative density of the standard band on that same gel. This creates a standardized measure of protein expression across all gels.
Loading Controls: Correcting for Unequal Loading
Loading controls, such as housekeeping proteins like actin or GAPDH, help assess variations in protein loading across lanes. Normalizing target protein band intensities to the corresponding loading control band intensities further refines the analysis.
Loading Control Normalization:
- Quantify the loading control band intensities using the same steps as for the target protein bands.
- Divide the relative density of each target protein band by the relative density of the corresponding loading control band in the same lane. This corrects for differences in total protein loaded in each lane.
Conclusion
Using ImageJ, researchers can accurately quantify and compare band intensities within and between western blots. By normalizing to a standard and incorporating loading controls, variations in experimental conditions can be minimized, leading to more reliable and comparable results. Accurate quantification is essential for drawing meaningful conclusions about protein expression levels.