While both the United States and Europe occupy roughly the same amount of land, approximately 10 million square kilometers (4 million square miles), a closer look reveals key differences beyond just physical size. Europe is slightly larger, exceeding the US by about 104,480 square kilometers (40,340 square miles). However, despite this similar landmass, Europe is significantly more densely populated, hosting more than double the population of the United States. Interestingly, the US economy is slightly larger than Europe’s, outstripping it by roughly $4.6 trillion. Let’s delve into a detailed comparison of their land area, population, economy, and more.
Land Area: A Closer Look at Size Distribution
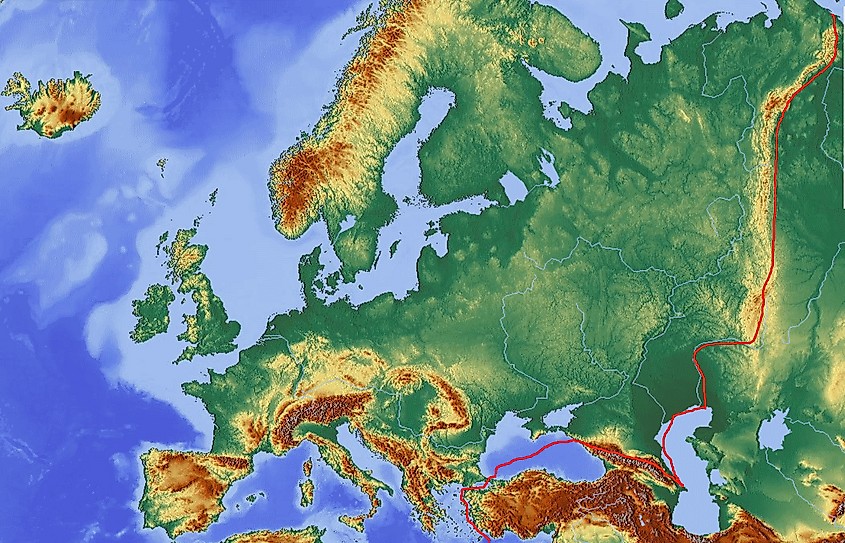
Europe Relief Map highlighting the geographical boundary with Asia.
Europe, a continent comprised of 47 diverse countries, encompasses a total area of 9,938,000 square kilometers (3,837,083 square miles). Within Europe, Russia stands out as the largest contributor to this landmass, with 3,972,400 square kilometers (1,533,752 square miles) of its territory situated within the continent. In stark contrast, Vatican City holds the title of the smallest country in Europe, and globally, spanning a mere 0.49 square kilometers (0.19 square miles).
A detailed topographical map illustrating the diverse terrain of the United States.
The United States, a single nation composed of 50 states, covers an approximate total of 9,833,520 square kilometers (3,796,742 square miles). Water bodies account for roughly 7% of the US’s total area. Alaska, the largest state, measures 1,723,337 sq km (665,384 sq mi), constituting nearly 18% of the entire US. Rhode Island, conversely, is the smallest state, covering just 4,002 square kilometers (1,545 square miles). The size difference between Europe and the US, at 104,480 square kilometers, is comparable to the land area of Iceland, illustrating how seemingly small differences can still represent significant geographical spaces.
Population Comparison: Density and Distribution
Population density map of the United States derived from Census data, showing population distribution.
As of 2024, the United States’ population is estimated to be nearly 342 million, positioning it as the third most populous country worldwide. California leads as the most populated state, home to over 39 million residents, followed by Texas with 30 million, and Florida with 22 million. Wyoming is the least populous state, with approximately 581,000 residents, showcasing the varied population distribution across the US.
Europe Population Heat Map based on UN data, visualizing population density across the continent.
Europe’s population is significantly larger, nearing 745 million, which is more than double that of the United States. Russia is the most populous country within Europe, with approximately 110 million people residing in its European territory, representing about 80% of Russia’s total population. Vatican City, again, stands at the other end of the spectrum as the least populous country in Europe, with only around 825 residents. This stark population difference highlights the higher population density across the continent of Europe compared to the United States.
Economic Strength Comparison: GDP and Wealth
Infographic depicting the wealthiest countries in North America, highlighting economic strengths.
While the economies of the US and Europe are of comparable size, the United States boasts a slightly larger nominal GDP. In fact, the US ranks as the eighth richest country globally, with a GDP per capita (PPP) of $85,372. Nominally, its GDP reaches $28.78 trillion, making it the largest economy in the world. Within the US, California has the most substantial economy, with a nominal GDP of $3.8 trillion, surpassing even the economy of India.
Infographic illustrating the top 10 richest countries in Europe, showcasing economic prosperity.
Europe is also home to numerous of the world’s wealthiest nations, including Luxembourg, Ireland, Switzerland, San Marino, Norway, Denmark, and The Netherlands. Luxembourg holds the title of the wealthiest country globally, with a GDP per capita (PPP) of $143,742. Germany possesses the largest economy among European countries, with a nominal GDP of approximately $3.85 trillion. Collectively, Europe’s economy has a nominal GDP of $24.22 trillion, approximately 84% of the size of the United States’ economy.
Driving Across Continents: Distance and Scale
Image of Sagres, Portugal, representing the furthest extreme of Europe reachable by driving.
Driving from one extreme point to another in both Europe and the United States involves journeys exceeding 5,000 kilometers (3,100 miles). However, the European route is marginally longer. The drive from Hammerfest, Norway, at Europe’s northeastern edge, to Sagres, Portugal, in the southwest, spans 5,490 kilometers (3,411 miles) and would take about 58 hours of continuous driving.
In comparison, driving across the US from Seattle, Washington, in the northwest, to Miami, Florida, in the southeast, covers approximately 5,311 kilometers (3,300 miles), requiring about 48 hours of non-stop driving. While Alaska is geographically further northwest than Seattle, this US route excludes Alaska due to the necessity of driving through Canada. These driving comparisons highlight the vastness of both regions and the scale of continental travel.
History and Evolution of Size: Growth Over Time
Historical map from 1775 showing the original 13 British colonies that grew into the USA.
Several European countries boast histories stretching back millennia. San Marino, founded in 301 CE, is the oldest in Europe. Denmark’s history dates back to around 700-800 CE, and France’s origins trace to 843. In contrast, the United States is a much younger nation, just under 250 years old. Furthermore, at its inception after declaring independence from Great Britain, it was considerably smaller than its current size.
Initially, in 1776, the United States comprised only thirteen states along the eastern Atlantic coast: New Hampshire, Rhode Island, Massachusetts, New Jersey, New York, Connecticut, Delaware, Pennsylvania, North Carolina, South Carolina, Virginia, Maryland, and Georgia. The Louisiana Purchase in 1803 marked the young nation’s first major territorial expansion, roughly doubling its land area. Sixteen years later, the US expanded again with the purchase of Florida from Spain.
In 1845, Texas was annexed, adding nearly 700,000 square kilometers (270,000 square miles). The 1848 Oregon Treaty with Britain further expanded US territory to include present-day Washington, Oregon, and Idaho. Alaska and Hawaii became the final two states in 1959, adding a total of 1,751,650 square kilometers (676,316 square miles). This historical overview illustrates the contrasting timelines and processes of territorial development between the long-established nations of Europe and the rapidly expanding United States.
Final Thoughts: Unity and Diversity in Landmass Comparison
Despite the United States being a single country and Europe a continent comprised of many, their comparable land areas naturally lead to comparisons. However, beyond size, significant differences emerge in population density, economies, cultural diversity, languages, and customs. Europe’s continental nature fosters immense variety, making generalizations about its numerous countries and systems challenging. Within the European Union alone, there are 24 official languages, and across the continent, over 200 languages are spoken. Therefore, distinguishing between a singular nation like the United States and a diverse continent like Europe, with its myriad cultural practices, economies, and governments, is crucial even when considering their similar geographical scale.