Surface finish from machining, also known as surface roughness, is a crucial factor that influences how a manufactured part interacts with its environment. COMPARE.EDU.VN offers an in-depth analysis and comparison of visual comparator charts used for evaluating surface finishes in machining, helping engineers and manufacturers make informed decisions. This comprehensive resource explores surface texture, machining process, and finishing techniques, empowering you to achieve optimal results.
1. Understanding Surface Roughness in Machining
Surface roughness in machining refers to the microscopic deviations in a surface’s true form. It’s a measure of the texture of a surface, quantified by the vertical deviations from a perfectly smooth ideal. The greater these deviations, the rougher the surface. In manufacturing, surface roughness plays a significant role in determining a part’s functionality, durability, and aesthetic appeal. Let’s explore the fundamentals of surface finish.
1.1 Defining Surface Roughness
Surface roughness is the measurement of the small, local deviations of a surface from its ideal form. These deviations are measured as the vertical distance between the peaks and valleys on the surface. Surface roughness is typically expressed as an average value, such as Ra (average roughness) or Rz (average maximum height).
1.2 Importance of Surface Roughness
The surface roughness of a machined part can significantly impact its performance and longevity. Here are some key reasons why surface roughness is important:
- Friction and Wear: Smoother surfaces reduce friction and wear between moving parts, extending their lifespan and improving efficiency.
- Sealing: A controlled surface roughness is essential for creating effective seals between mating surfaces, preventing leaks and maintaining pressure.
- Adhesion: The roughness of a surface can affect the adhesion of coatings, paints, and adhesives. A slightly rough surface can provide better adhesion than a perfectly smooth surface.
- Aesthetics: Surface roughness can influence the aesthetic appeal of a product. A smooth, polished surface may be desired for decorative parts, while a textured surface may be preferred for functional components.
- Fatigue Life: Surface roughness can affect the fatigue life of a part, especially in applications involving cyclic loading. Smoother surfaces tend to have better fatigue resistance.
- Corrosion Resistance: Surface roughness can influence the corrosion resistance of a material. Smoother surfaces are generally less susceptible to corrosion.
1.3 Factors Affecting Surface Roughness
Several factors influence the surface roughness of a machined part, including:
- Machining Process: Different machining processes, such as milling, turning, grinding, and polishing, produce different surface roughness characteristics.
- Cutting Tool Geometry: The geometry of the cutting tool, including its shape, sharpness, and material, affects the surface finish.
- Cutting Parameters: Cutting parameters, such as cutting speed, feed rate, and depth of cut, influence the surface roughness.
- Material Properties: The properties of the material being machined, such as hardness, ductility, and grain structure, affect the surface finish.
- Coolant and Lubrication: The use of coolant and lubrication can reduce friction and heat during machining, improving the surface finish.
- Machine Tool Condition: The condition of the machine tool, including its rigidity, vibration, and alignment, affects the surface finish.
2. Units of Measurement for Surface Roughness
Understanding the units of measurement for surface roughness is crucial for specifying and controlling surface finish requirements. Several parameters are used to quantify surface roughness, each providing different information about the surface texture.
2.1 Ra (Roughness Average)
Ra, also known as the arithmetic average roughness, is the most commonly used parameter for specifying surface roughness. It represents the arithmetic mean of the absolute values of the surface height deviations from the mean line, within a specified evaluation length.
The formula for Ra is:
Ra = (1/L) ∫|y(x)| dx
where:
- L is the sampling length
- y(x) is the vertical deviation from the mean line at a distance x along the surface
Ra provides a general indication of the surface roughness but does not capture information about the shape or spacing of the surface features.
2.2 Rz (Average Maximum Height)
Rz, also known as the average maximum height of the profile, represents the average of the five largest peak-to-valley heights within the evaluation length. Rz is more sensitive to isolated peaks and valleys than Ra, providing a better indication of the maximum surface irregularities.
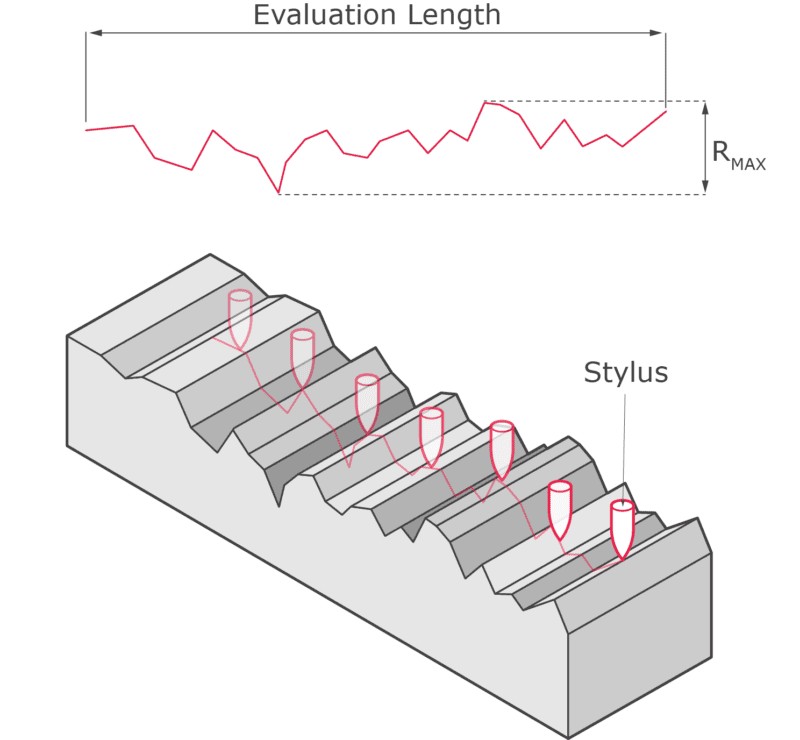
2.3 Rmax (Maximum Roughness)
Rmax, also known as the maximum peak-to-valley height, represents the largest vertical distance between the highest peak and the lowest valley within the evaluation length. Rmax provides the most extreme measure of surface roughness and is often used in applications where surface integrity is critical.
2.4 Other Parameters
Other parameters used to quantify surface roughness include:
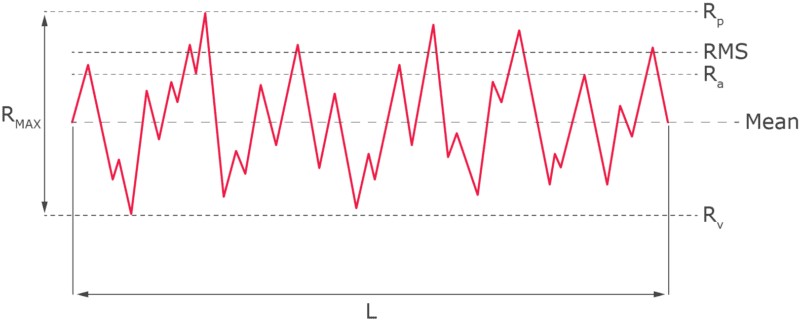
- Rq (Root Mean Square Roughness): The root mean square average of profile height variation from the mean line.
- Rp (Maximum Peak Height): The calculated distance between the profile’s tallest peak and the mean line within the evaluation length.
- Rv (Maximum Valley Depth): The calculated distance between the profile’s lowest valley and the mean line within the evaluation length.
- RMS (Root Mean Square): Calculated within the evaluation length, this is the root mean square average of profile height variation from the mean line.
3. Standard Surface Finishes in Machining
The standard surface finish for a machined part typically ranges from 3.2 μm Ra to 1.6 μm Ra. However, the specific surface finish requirements depend on the application and the desired performance characteristics.
3.1 Achievable Surface Roughness Averages
Achievable surface roughness averages through CNC machining include:
- 3.2 μm Ra: This is the most common and least expensive surface finish for machined parts. It leaves visible tool marks and is suitable for parts intended to experience vibrations, heavy loads, or stress.
- 1.6 μm Ra: This finish shows fewer cut marks and provides a smoother surface than 3.2 μm Ra. It’s a good balance between cost and performance for many applications.
- 0.8 μm Ra: This finish provides a smooth, uniform surface with minimal visible tool marks. It’s suitable for parts requiring good sealing, low friction, or a visually appealing appearance.
- 0.4 μm Ra: This finish is the smoothest achievable surface roughness through CNC machining. It’s used for critical applications requiring high precision, low friction, or optimal sealing.
3.2 Types of Machining Finishes
Machining finishes refer to the final surface texture and appearance of a part after machining. Here are some common types of machining finishes:
- As-Machined Finish: The surface finish results directly from the machining process without post-processing. It may have visible tool marks and is not typically very smooth.
- Smooth Finish: Achieved through processes like grinding or honing, this finish has a very fine surface texture. It’s ideal for parts that require a smooth surface for functional or aesthetic reasons.
- Textured Finish: Some parts may require a textured surface for grip, aesthetics, or other functional reasons. This can be achieved through processes like knurling or bead blasting.
- Mirror Finish: This is a highly polished finish that reflects light, similar to a mirror. It’s achieved through extensive polishing and is often used for decorative parts.
- Anodized Finish: For metals like aluminum, an anodizing process can be used to create a protective oxide layer on the surface. This not only provides protection but can also add color to the part.
4. Choosing the Suitable Surface Roughness
Selecting the suitable surface roughness for your project requires careful consideration of several factors, including the application, durability, desired aesthetic, and budget.
4.1 Factors to Consider
- Application: The intended application of the part is the most important factor to consider. Parts that require low friction, good sealing, or high precision will require smoother surfaces than parts that are primarily structural.
- Durability: The surface roughness can affect the durability of a part. Smoother surfaces are generally more resistant to wear and corrosion.
- Aesthetics: The desired aesthetic appearance of the part should also be considered. Smooth, polished surfaces may be preferred for decorative parts, while textured surfaces may be preferred for functional components.
- Budget: The cost of achieving different surface roughness values can vary significantly. Smoother surfaces generally require more expensive machining processes and finishing operations.
4.2 Surface Roughness Recommendations
- 3.2 μm Ra: Suitable for low-budget projects that may receive other forms of finishing later, such as painting or polishing.
- 1.6 μm Ra: A good balance between cost and performance for many applications.
- 0.8 μm Ra: Ideal for parts requiring good sealing, low friction, or a visually appealing appearance.
- 0.4 μm Ra: Necessary for projects that require control and perfect dimensions, especially for parts exposed to concentrated stress.
5. Achieving Different Levels of Surface Roughness
Different levels of surface roughness are achieved through various machining processes and finishing operations. The choice of process depends on the desired surface roughness, material properties, and budget constraints.
5.1 Machining Processes
- Turning: Turning is a machining process that uses a cutting tool to remove material from a rotating workpiece. It’s commonly used to create cylindrical parts with a wide range of surface finishes.
- Milling: Milling is a machining process that uses a rotating cutter to remove material from a stationary workpiece. It’s used to create complex shapes and features with various surface finishes.
- Grinding: Grinding is an abrasive machining process that uses a rotating grinding wheel to remove material from a workpiece. It’s used to achieve very smooth surfaces and tight tolerances.
- Polishing: Polishing is a finishing process that uses abrasive compounds to smooth and refine the surface of a part. It’s used to achieve mirror-like finishes and improve aesthetic appeal.
5.2 Surface Finishing Techniques
- As-Machined: Leaving a product with an as-machined finish ensures the tightest dimensional tolerances, typically up to ± 0.05 mm or better. However, there will be visible tool marks, and the parts may appear dull.
- Bead Blasting: A bead-blasted finish is achieved using a pressurized air gun to blast small glass beads onto the surface, leaving a matte or satin finish and a faint surface texture. This uniform finish can hide tool marks created on a machined part.
- Anodizing: Anodizing is a process that adds a thin but highly protective oxidized layer to metal parts. The coating is electrically non-conductive with high hardness qualities and is compatible with Aluminum and Titanium alloys.
5.3 Cost Considerations
The cost of achieving different surface roughness values can vary significantly. Smoother surfaces generally require more expensive machining processes and finishing operations. Factors that impact the cost of surface roughness finishes include:
- Machining Time: Achieving smoother surfaces typically requires more machining time, which increases labor costs.
- Tooling Costs: Specialized cutting tools and grinding wheels may be required to achieve specific surface roughness values.
- Finishing Operations: Finishing operations, such as polishing and lapping, can be time-consuming and labor-intensive.
- Material Removal: Achieving smoother surfaces may require more material removal, which can increase material costs.
6. Visual Comparator Chart for Surface Finish
A visual comparator chart is a tool used to manually assess a manufactured product’s surface roughness or finish. The comparator displays industry-standard finish grades against which a product’s surface can be compared. This method of assessing surface roughness relies on a tactile and visual comparison.
6.1 How to Use a Surface Roughness Comparator
Using a surface roughness comparator involves comparing the surface of a manufactured part with the reference surfaces on the comparator. The user visually and tactilely assesses the similarity between the part’s surface and the comparator’s reference surfaces to determine the surface roughness grade.
6.2 Types of Surface Roughness Comparators
Surface roughness comparators are typically available in sets, each representing a different manufacturing process or surface finish. Common types of comparators include:
- Machined Surface Comparators: These comparators feature reference surfaces representing common machining processes, such as milling, turning, and grinding.
- Cast Surface Comparators: These comparators feature reference surfaces representing different casting processes, such as sand casting, investment casting, and die casting.
- Blasted Surface Comparators: These comparators feature reference surfaces representing different blasting processes, such as bead blasting and sandblasting.
- Polished Surface Comparators: These comparators feature reference surfaces representing different polishing processes, such as buffing and lapping.
6.3 Advantages and Disadvantages of Visual Comparators
Advantages:
- Cost-Effective: Visual comparators are relatively inexpensive compared to other surface roughness measurement methods.
- Easy to Use: Visual comparators are simple to use and require minimal training.
- Portable: Visual comparators are small and portable, making them suitable for use in the field.
Disadvantages:
- Subjective: The accuracy of visual comparators depends on the user’s skill and experience, making the method subjective.
- Limited Accuracy: Visual comparators provide a qualitative assessment of surface roughness and are not suitable for applications requiring high precision.
- Limited Range: Visual comparators typically cover a limited range of surface roughness values.
6.4 When to Use a Surface Roughness Comparator
A surface roughness comparator is a cost-effective and easily accessible means of assessing surface roughness. Use a surface roughness comparator when:
- Low accuracy is acceptable
- A quick, on-the-spot assessment is needed
- Budget constraints prevent the use of more sophisticated methods
7. Measuring Surface Roughness
Surface roughness can be measured using various methods, ranging from manual comparison to advanced digital techniques. The choice of method depends on the required accuracy, the surface characteristics, and the available budget.
7.1 Contact Profilometer
A contact profilometer works by measuring the displacement of a diamond stylus as it is moved across the surface of a manufactured component. The stylus is displaced along a product’s surface, typically measuring up to 25mm. This displacement is then converted into digital values displayed on the profilometer screen.
Should I use a contact profilometer?
Contact profilometers offer high accuracy in determining surface roughness. However, some limitations are associated with contact profilometer techniques. When in contact with the surface during the measurement process, the stylus can potentially cause damage to a product surface. Also, it is slower than non-contact techniques, which can potentially slow down the process of assembly if employed within mass-production processes.
7.2 Non-Contact Profilometer
A non-contact profilometer can be employed via several techniques, including laser triangulation, confocal microscopy, and digital holography. However, the most common application of a non-contact profilometer comes in the form of optical profilometry, which uses light rather than a physical probe, such as a stylus.
Should I use a non-contact profilometer?
Non-contact profilometers are very reliable and able to measure surface variation to within micrometers. Non-contact methods such as this also represent a cheaper option than their contact counterparts and enable a faster method of calculating surface roughness. A non-contact surface measurement tool can measure a larger area as it is not dictated by the size of a stylus tip.
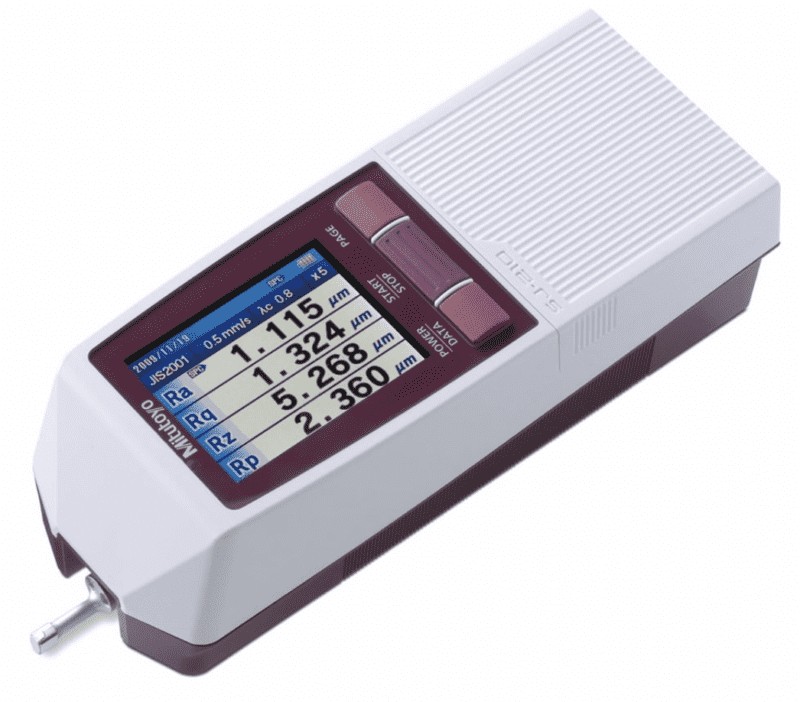
7.3 Portable Surface Roughness Tester
Although still digital, a portable surface roughness tester can take surface measurements without being connected to a mains power outlet. With a backlit screen to show its findings, this device can display sectional calculation results and amplitude distribution curves, as well as its original surface roughness calculations. Similar to a contact profilometer, this device also uses a stylus to undertake its measurements.
7.4 Surface Roughness Comparator
A surface roughness comparator is used to manually assess a manufactured product’s surface roughness or finish. Selected in accordance with the manufacturing process used and desired finish, comparators display industry-standard finish grades, against which a product’s surface can be compared.
Should I use a surface roughness comparator?
Although a surface roughness comparator represents a cost-effective and easily accessible means of assessing surface roughness, it also possesses an obvious weakness. Deviations in a product’s surface are calculated using judgments passed either by touch or aesthetic appearance, and the level of accuracy achieved via this method is lower than those undertaken by the use of a profilometer.
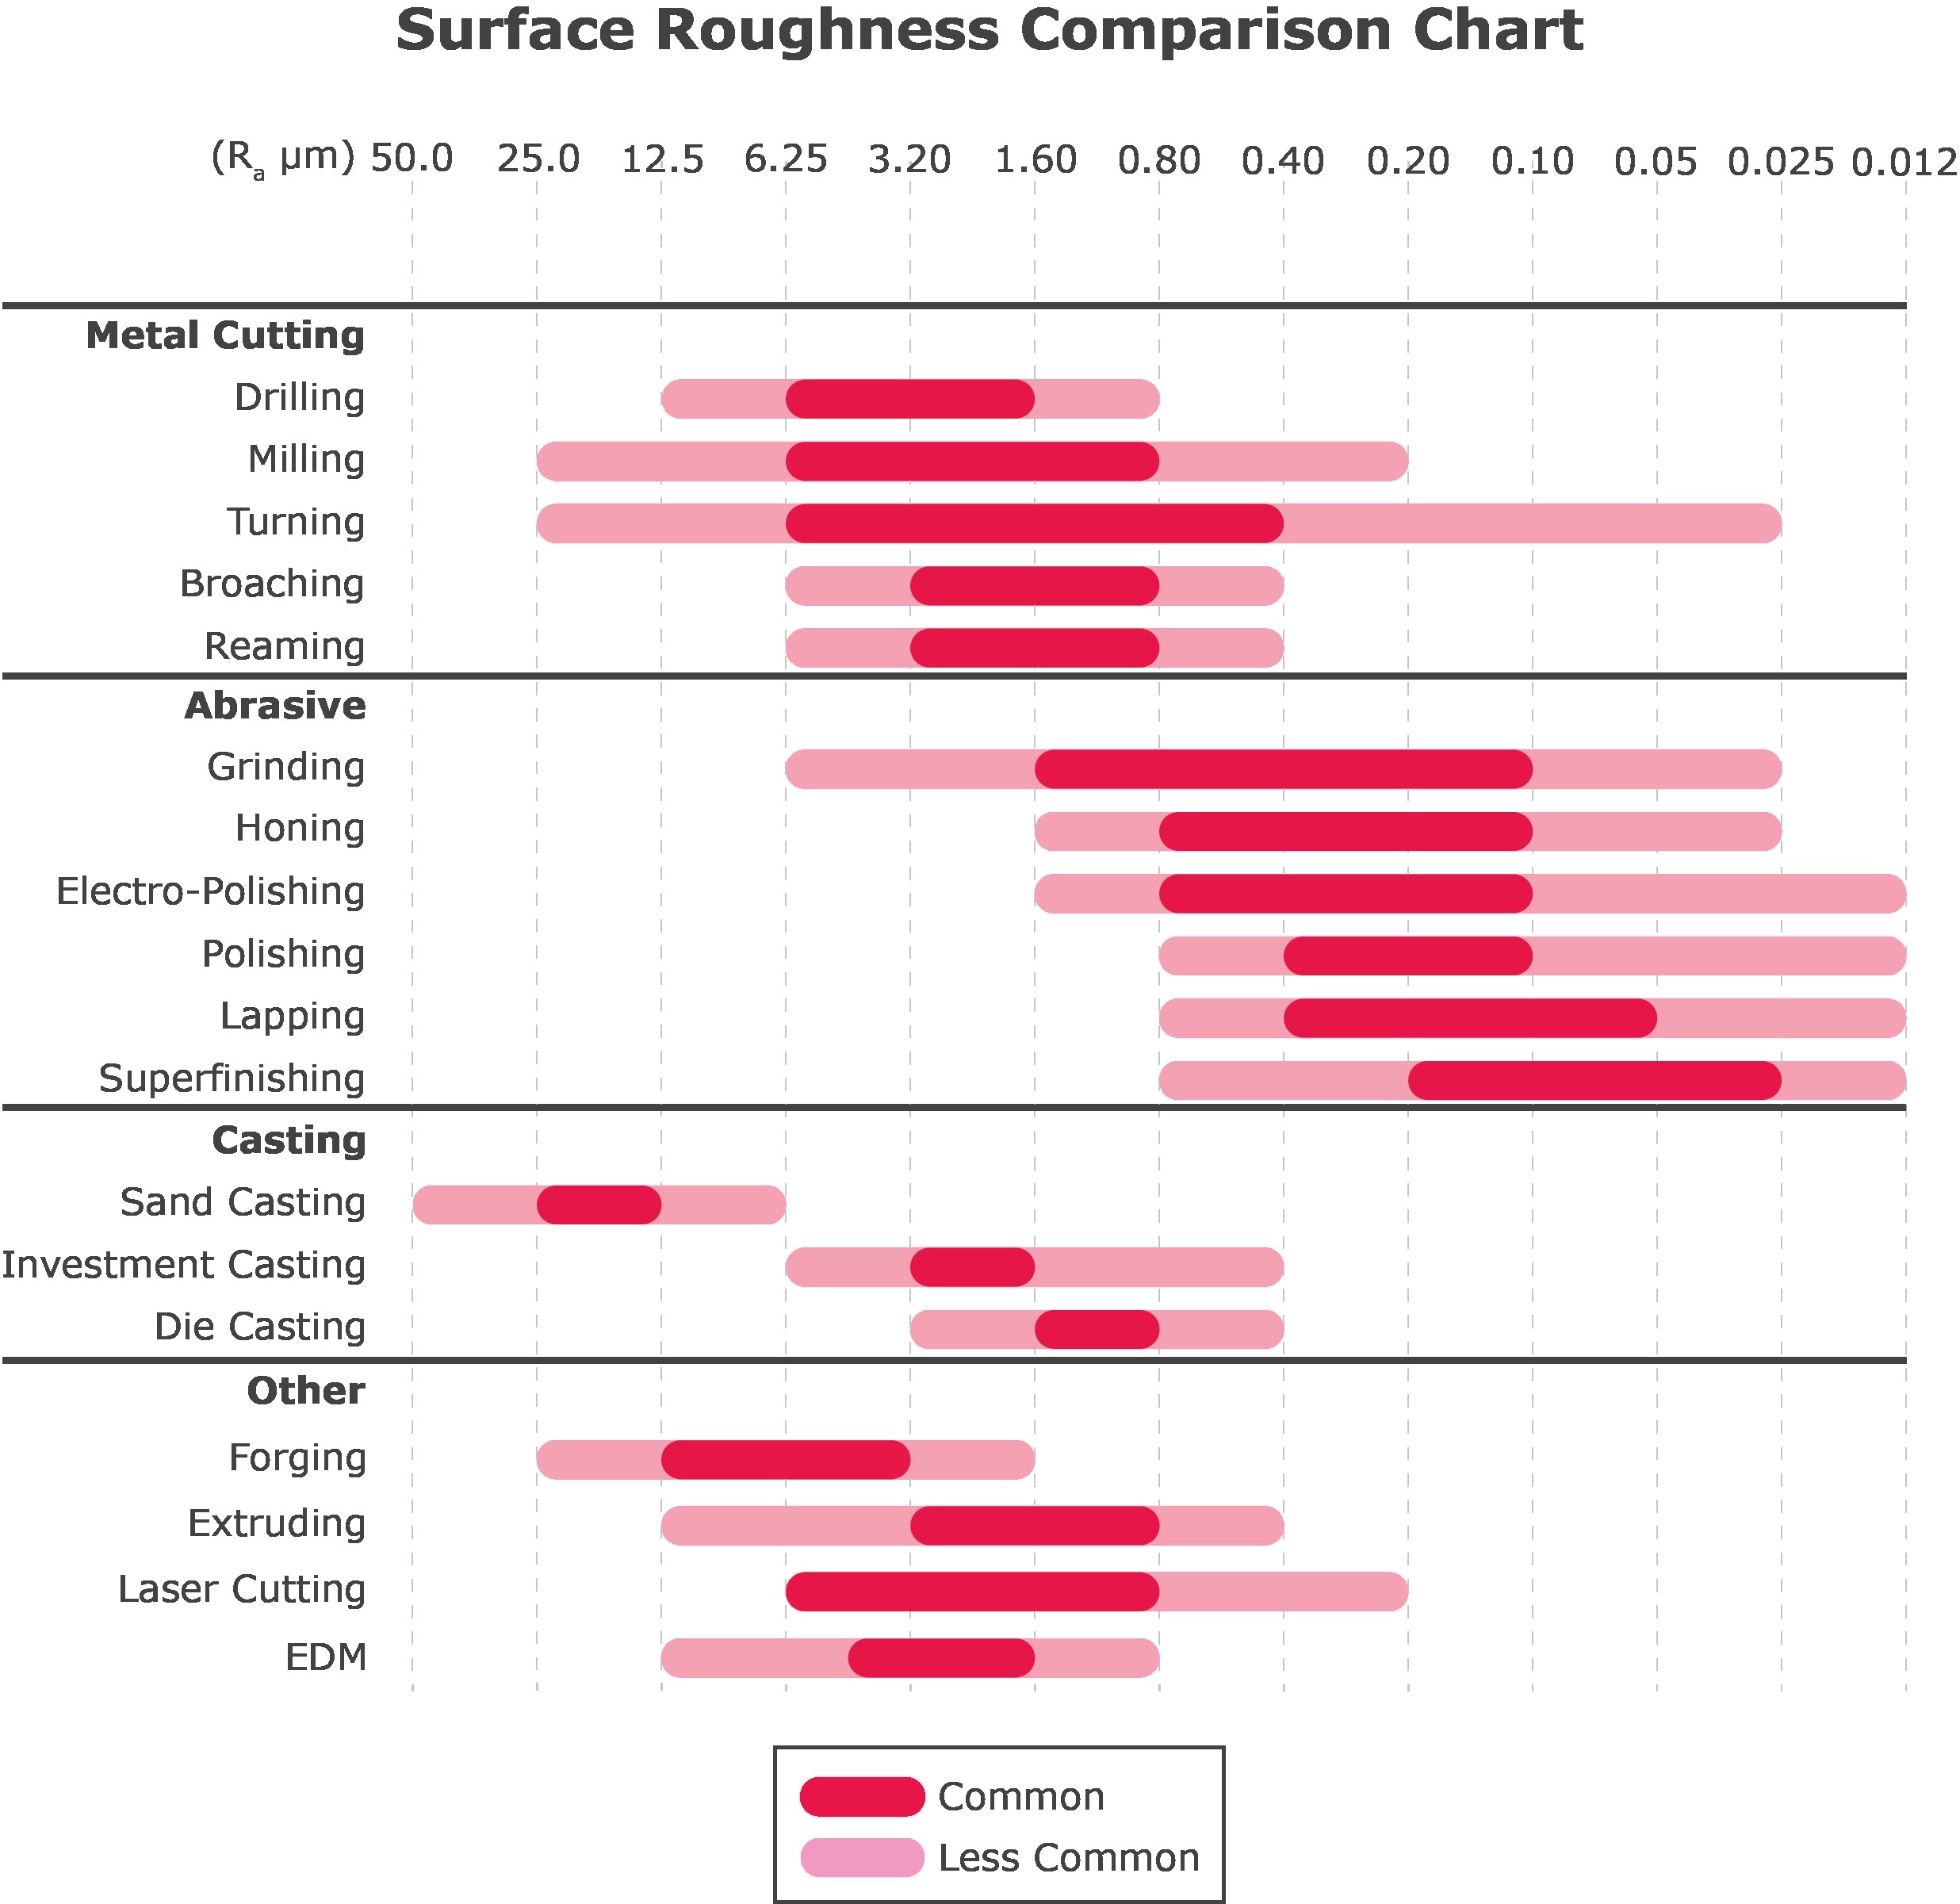
8. Manufacturing Surface Roughness Comparison Chart
A surface roughness comparison chart is an important guideline for engineers, enabling them to compare common surface roughness values for different manufacturing processes. Being able to understand a chart such as this and the conversion between contrasting units of measurement is a useful addition to any engineer’s arsenal.
9. Surface Roughness Symbols and Abbreviations
The surface roughness chart below denotes the various surface roughness symbols and abbreviations commonly used within engineering practices and the meaning behind them. Understanding these symbols is crucial in achieving the desired finish of your manufactured part.
The marks made by the cutting tool during machining when forming a radial pattern in relation to the center of the surface on which the symbol is shown. Here are the symbols and their meanings:
- =: The marks made by a cutting tool during machining when parallel with the surface or view on the drawing.
- ⊥: The marks made by the cutting tool during machining that are perpendicular to the surface or view on the drawing.
- X: The marks made by the cutting tool during machining when at an angle and cross each other, in a criss-cross pattern.
- M: The marks made commonly by polishing or lapping that cross multiple times or have no set direction.
- C: The marks made by the cutting tool when forming mostly concentric circles in relation to the center of the surface.
- R: The marks made by a cutting tool during machining when parallel with the surface.
10. Surface Roughness Conversion Table
The table below is a conversion between industry-standard units used within the surface roughness measuring process. Understanding the conversion between alternative industry-standard units, such as surface roughness Ra in metric and imperial, and ISO can be useful when finalizing considerations for your desired surface finish.
| Ra (Micro-meters) | Ra (Micro-inches) | Rt** | N |
|---|---|---|---|
| 0.025 | 1 | 0.3 | N1 |
| 0.05 | 2 | 0.5 | N2 |
| 0.1 | 4 | 0.8 | N3 |
| 0.2 | 8 | 1.2 | N4 |
| 0.4 | 16 | 2 | N5 |
| 0.8 | 32 | 4 | N6 |
| 1.6 | 63 | 8 | N7 |
| 3.2 | 125 | 13 | N8 |
| 6.3 | 250 | 25 | N9 |
| 12.5 | 500 | 50 | N10 |
| 25 | 1000 | 100 | N11 |
| 50 | 2000 | 200 | N12 |
Ra – Surface roughness, measured in both micro-meters and micro-inches
Rt – Roughness, total in microns
N – ISO 1302 Roughness grade numbers.
11. Surface Finish Measurements
Surface finish measurements are essential metrics used to quantify the texture and topography of a manufactured surface. These measurements provide insights into the quality, functionality, and aesthetic appeal of a product. The process involves assessing the deviations and irregularities on a surface, which can be caused by various manufacturing processes such as machining, grinding, casting, and more.
11.1 How to Perform Surface Finish Measurements
- Select the Appropriate Instrument – Depending on the type of surface and the level of precision required, choose a suitable instrument. Common tools include profilometers, interferometers, and atomic force microscopes.
- Prepare the Surface – Ensure the surface is clean and free from contaminants. Any debris or dirt can affect the accuracy of the measurements.
- Calibrate the Instrument – Before taking measurements, calibrate the instrument according to the manufacturer’s guidelines.
- Measure the Surface – Glide the instrument’s probe or sensor across the surface to capture a profile. This profile represents the peaks and valleys of the surface texture.
- Analyze the Data – Using specialized software, analyze the captured data to determine key parameters such as Ra (average roughness), Rz (maximum height), and more.
11.2 Significance of Surface Finish Measurements
By understanding and controlling surface finish measurements, manufacturers can ensure that their products meet desired specifications and performance criteria.
12. FAQ about Visual Comparator Charts for Surface Finish
Here are some frequently asked questions about visual comparator charts for surface finish:
- What is a visual comparator chart for surface finish?
A visual comparator chart is a tool used to manually assess a manufactured product’s surface roughness or finish by comparing it to reference surfaces with known roughness values. - How does a visual comparator chart work?
It works by visually and tactilely comparing the surface of a manufactured part with the reference surfaces on the comparator to determine the surface roughness grade. - What are the advantages of using a visual comparator chart?
It’s cost-effective, easy to use, and portable. - What are the limitations of using a visual comparator chart?
It’s subjective, has limited accuracy, and covers a limited range of surface roughness values. - When should I use a visual comparator chart?
When low accuracy is acceptable, a quick on-the-spot assessment is needed, and budget constraints prevent the use of more sophisticated methods. - What are the different types of surface roughness comparators?
Machined surface comparators, cast surface comparators, blasted surface comparators, and polished surface comparators. - How do I choose the right surface roughness for my project?
Consider the application, durability requirements, desired aesthetics, and budget constraints. - What are the common units of measurement for surface roughness?
Ra (Roughness Average), Rz (Average Maximum Height), and Rmax (Maximum Roughness). - How do I measure surface roughness?
Using a contact profilometer, non-contact profilometer, portable surface roughness tester, or surface roughness comparator. - Where can I find more information about surface finish measurements?
Additional information can be found via resources published by Get It Made and COMPARE.EDU.VN.
Conclusion
Understanding and controlling surface roughness is essential for achieving optimal performance, durability, and aesthetic appeal in machined parts. A visual comparator chart for surface finish is a valuable tool for engineers and manufacturers to quickly assess and compare surface roughness values. While it may not be as precise as other methods, it provides a cost-effective and convenient way to ensure that parts meet the required surface finish specifications. For more detailed information and comparisons, visit COMPARE.EDU.VN. Our comprehensive resources will help you make informed decisions and achieve the best possible results for your projects.
Need help comparing surface finishes or choosing the right machining process for your project? Contact us at 333 Comparison Plaza, Choice City, CA 90210, United States, or reach out via WhatsApp at +1 (626) 555-9090. Visit compare.edu.vn today to explore our extensive resources and find the perfect solution for your needs.