A two-way table, also known as a contingency table, is a powerful tool in statistics for organizing and analyzing the relationship between two categorical variables. It allows researchers to summarize and compare the distributions of one variable across different categories of another. But what exactly can a two-way table summarize and compare? This article will delve into the specific uses of this valuable statistical tool.
Understanding the Structure of a Two-Way Table
A two-way table is structured with rows representing the categories of one variable and columns representing the categories of the other. The cells within the table hold the frequencies or counts of observations that fall into each combination of categories. Margins along the bottom and right side of the table display the totals for each row and column respectively.
For example, a two-way table could be used to examine the relationship between gender (male/female) and preferred mode of transportation (car/bus/bike). The rows would represent gender, the columns would represent transportation mode, and each cell would contain the number of individuals who fall into that specific combination (e.g., the number of females who prefer to travel by car).
Summarizing Distributions with Two-Way Tables
A two-way table summarizes:
- Frequency Distributions: The table shows the number of observations in each category for both variables. This allows for a quick understanding of the overall distribution of each variable individually. Referring back to the transportation example, you could quickly see how many total males and females participated in the survey and how many people prefer each mode of transportation.
- Joint Distributions: The table reveals the frequency of each combination of categories. This provides insights into how the two variables interact. You could observe if a certain transportation mode is more popular among one gender than the other.
Comparing Distributions with Two-Way Tables
The real power of a two-way table lies in its ability to compare distributions:
- Conditional Distributions: By calculating percentages within each row or column, we can compare the distribution of one variable conditioned on the other. In our example, we could calculate the percentage of males who prefer each transportation mode and compare it to the percentage of females who prefer each mode. This reveals potential relationships between gender and transportation preference. For instance, if a significantly higher percentage of females choose the bus compared to males, it suggests a possible association. These percentages are called conditional percentages.
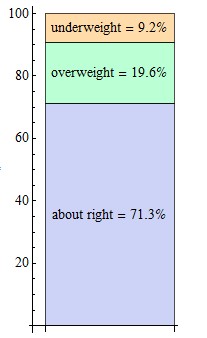
- Identifying Associations: While a two-way table doesn’t prove causation, significant differences in conditional distributions can suggest an association between the two variables. This is a crucial step in exploring relationships and forming hypotheses for further research. For example, observing differing body image perceptions between genders, as shown below, suggests a potential association warranting deeper investigation.
Conclusion
A two-way table is a fundamental tool for summarizing and comparing the relationship between two categorical variables. It provides a clear and concise way to analyze frequency distributions, joint distributions, and conditional distributions. By examining these distributions, researchers can identify potential associations between variables, paving the way for more in-depth statistical analysis. The ability to visualize and quantify these relationships makes the two-way table an indispensable asset in fields ranging from healthcare to social sciences and market research.