A nominal variable, representing categories without inherent order, often necessitates comparisons between groups in research. This involves analyzing differences in the distribution of data across these categories. A common statistical tool for this purpose is the Chi-square test, which assesses whether observed differences are statistically significant. This article explores the scenarios where a nominal variable requires researcher comparison, focusing on the application and interpretation of the Chi-square test.
Understanding Nominal Variables and the Need for Comparison
Nominal variables categorize data into distinct groups, such as gender (male, female), eye color (blue, brown, green), or disease presence (yes, no). When researchers collect data on a nominal variable, they often want to determine if there are relationships between this variable and other factors. For instance, a researcher might want to know if there’s a link between smoking (yes, no) and lung cancer diagnosis (yes, no). This requires comparing the proportions of smokers and non-smokers who develop lung cancer. This is where statistical tests like the Chi-square come into play.
The Chi-Square Test: A Cornerstone of Nominal Variable Comparison
The Chi-square test examines the observed frequencies in each category of a nominal variable compared to the frequencies that would be expected if there were no relationship between the variables. A significant Chi-square result indicates that the observed frequencies differ significantly from the expected frequencies, suggesting a potential association between the variables.
For example, let’s consider a study investigating the relationship between political affiliation (Democrat, Republican, Independent) and voting preference in an upcoming election (Candidate A, Candidate B). The Chi-square test would compare the actual number of individuals in each political affiliation group who prefer each candidate to the expected number if political affiliation had no influence on voting preference. A statistically significant result would suggest a relationship between political affiliation and candidate preference.
Interpreting the Chi-Square Test: Beyond Significance
While a statistically significant Chi-square result indicates a potential relationship, it’s crucial to delve deeper into the data to understand the nature of this relationship. Examining the individual cell contributions to the Chi-square statistic can reveal which specific categories are driving the association. For instance, in the voting preference example, a detailed analysis might show that Independents disproportionately favor Candidate B.
Furthermore, it’s essential to consider effect size measures, such as Cramer’s V, alongside statistical significance. Effect size quantifies the strength of the association between the variables. A significant Chi-square result with a small effect size might not be practically meaningful.
Beyond the Chi-Square: Other Methods for Comparing Nominal Variables
While the Chi-square test is widely used, other statistical techniques are available for comparing nominal variables depending on the specific research question and data structure. For 2×2 contingency tables (two variables, each with two categories), Fisher’s exact test offers an alternative, particularly when sample sizes are small. When dealing with ordinal categorical data (categories with a meaningful order), tests like the Mann-Whitney U test or Kruskal-Wallis test might be more appropriate.
Conclusion: The Importance of Rigorous Comparison
When a nominal variable is central to a research question, comparing groups becomes paramount. The Chi-square test, along with other appropriate statistical methods, provides the necessary tools to determine if observed differences are statistically significant and to quantify the strength of any associations. By carefully analyzing both significance and effect size, researchers can gain valuable insights into the relationships between nominal variables and other factors, leading to a more nuanced understanding of the phenomena under investigation.
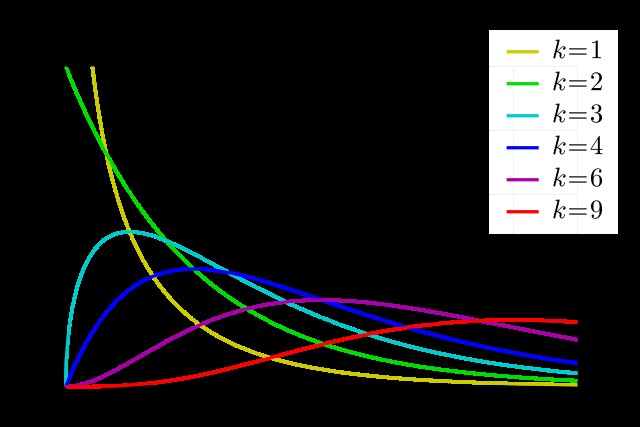 alt text for image showing a chi-square distribution