The comparable company approach, also known as “comps,” is a vital valuation tool used to assess a business’s worth by examining the ratios of similar publicly traded companies. COMPARE.EDU.VN offers in-depth comparisons and analyses to help you understand and apply this valuation method effectively. Analyzing related businesses, financial metrics, and valuation multiples allows you to benchmark performance, discover investment prospects, and make informed business choices.
1. Understanding the Comparable Company Approach
The comparable company approach, or “comps,” is a relative valuation method that values a company by comparing it to its peers. Unlike intrinsic valuation methods like Discounted Cash Flow (DCF) analysis, which rely on a company’s own financial projections, the comps approach uses market data from similar publicly traded companies.
1.1. What is a Comparable Company?
A comparable company is a publicly traded company that operates in the same industry, has a similar business model, and faces similar risks and opportunities as the company being valued (the “target company”).
1.2. Why Use the Comparable Company Approach?
The comparable company approach offers several advantages:
- Market-based: It reflects current market sentiment and investor expectations.
- Easy to Understand: It is relatively simple to calculate and interpret.
- Readily Available Data: The data required is usually accessible from financial databases.
- Useful for Relative Valuation: It helps identify whether a company is overvalued or undervalued compared to its peers.
1.3. Limitations of the Comparable Company Approach
Despite its benefits, the comparable company approach has some limitations:
- Finding Truly Comparable Companies: It can be challenging to find companies that are perfectly comparable.
- Market Distortions: Market conditions can influence multiples, leading to inaccurate valuations.
- Lack of Company-Specific Factors: It may not fully capture the unique aspects of the target company.
- Reliance on Public Information: The accuracy depends on the availability and reliability of public data.
1.4. Key Steps in Applying the Comparable Company Approach
- Identify Comparable Companies: Select publicly traded companies that are similar to the target company.
- Gather Financial Data: Collect financial information for the comparable companies, including revenue, earnings, and market capitalization.
- Calculate Valuation Multiples: Calculate key valuation multiples for the comparable companies, such as Price-to-Earnings (P/E), Enterprise Value-to-EBITDA (EV/EBITDA), and Price-to-Sales (P/S).
- Determine the Appropriate Multiple: Based on the range of multiples observed in the comparable companies, determine the multiple that is most appropriate for the target company.
- Apply the Multiple: Apply the chosen multiple to the relevant financial metric of the target company to estimate its value.
2. Identifying Comparable Companies: A Detailed Guide
Finding the right comparable companies is crucial for an accurate valuation. This process involves a combination of industry knowledge, financial analysis, and judgment.
2.1. Key Criteria for Identifying Comparable Companies
- Industry: Companies should operate in the same industry or a closely related industry.
- Business Model: Companies should have similar business models, including revenue sources, cost structures, and customer bases.
- Size: Companies should be of a similar size in terms of revenue, assets, and market capitalization.
- Growth Rate: Companies should have similar growth rates, as high-growth companies typically trade at higher multiples.
- Profitability: Companies should have similar profitability margins, such as gross margin, operating margin, and net margin.
- Geography: Companies should operate in similar geographic regions, as economic conditions and market dynamics can vary significantly across regions.
2.2. Resources for Finding Comparable Companies
- Financial Databases: Bloomberg, Capital IQ, and Thomson Reuters Eikon provide detailed company information and industry classifications.
- Industry Reports: Research reports from investment banks and consulting firms often identify key players in various industries.
- Company Filings: Annual reports (10-K) and quarterly reports (10-Q) provide insights into a company’s business and competitors.
- Professional Networks: Industry conferences and networking events can offer valuable insights into the competitive landscape.
2.3. Refining the List of Comparable Companies
Once you have identified a preliminary list of comparable companies, it’s essential to refine the list based on more detailed analysis.
- Review Company Descriptions: Read the company descriptions in financial databases and company filings to understand their core business activities.
- Analyze Financial Statements: Examine the financial statements of each company to assess their financial performance and identify any significant differences.
- Consider Qualitative Factors: Evaluate qualitative factors such as management quality, brand reputation, and competitive advantages.
- Remove Outliers: Exclude companies that are significantly different from the target company or that have unusual financial results.
2.4. Example of Identifying Comparable Companies
Suppose you are valuing a software company that specializes in cloud-based project management tools. Here’s how you might identify comparable companies:
- Initial Screening: Use a financial database to search for publicly traded companies in the “software” industry.
- Refine by Business Model: Narrow down the list to companies that offer cloud-based project management tools or similar software solutions.
- Consider Size and Growth: Focus on companies with similar revenue and growth rates as the target company.
- Analyze Financial Performance: Compare the profitability margins and financial ratios of the potential comparable companies.
- Final Selection: Choose the companies that are most similar to the target company in terms of industry, business model, size, growth, and profitability.
3. Gathering Financial Data for Comparable Company Analysis
Accurate and reliable financial data is essential for performing a robust comparable company analysis. This data is used to calculate valuation multiples and benchmark the target company against its peers.
3.1. Key Financial Data to Collect
- Revenue: Total sales generated by the company.
- Gross Profit: Revenue less the cost of goods sold.
- EBITDA: Earnings before interest, taxes, depreciation, and amortization.
- EBIT: Earnings before interest and taxes.
- Net Income: Profit after all expenses and taxes.
- Market Capitalization: The total value of a company’s outstanding shares.
- Enterprise Value (EV): Market capitalization plus debt, minus cash and cash equivalents.
- Debt: Total amount of short-term and long-term debt.
- Cash and Cash Equivalents: Liquid assets that can be easily converted into cash.
- Shares Outstanding: The number of shares of common stock held by investors.
3.2. Sources of Financial Data
- Financial Databases: Bloomberg, Capital IQ, and Thomson Reuters Eikon provide comprehensive financial data for publicly traded companies.
- Company Filings: Annual reports (10-K) and quarterly reports (10-Q) filed with the Securities and Exchange Commission (SEC) contain detailed financial statements.
- Investor Relations Websites: Most publicly traded companies have investor relations websites that provide access to financial information and investor presentations.
- Earnings Call Transcripts: Transcripts of earnings calls can provide valuable insights into a company’s financial performance and outlook.
3.3. Tips for Gathering Financial Data
- Use Consistent Definitions: Ensure that you are using consistent definitions for financial metrics across all companies.
- Adjust for Non-Recurring Items: Remove any non-recurring items that could distort the financial results.
- Use Trailing Twelve Months (TTM) Data: Use TTM data to capture the most recent financial performance.
- Verify Data Accuracy: Double-check the data to ensure that it is accurate and reliable.
- Document Your Sources: Keep a record of your data sources for future reference.
3.4. Example of Gathering Financial Data
To gather financial data for a comparable company, you might follow these steps:
- Access a Financial Database: Log in to Bloomberg, Capital IQ, or Thomson Reuters Eikon.
- Search for the Company: Enter the company’s ticker symbol or name to find its financial profile.
- Download Financial Statements: Download the company’s income statement, balance sheet, and cash flow statement.
- Extract Key Data: Extract the key financial data points listed above, such as revenue, EBITDA, and market capitalization.
- Verify and Adjust Data: Verify the data for accuracy and adjust for any non-recurring items.
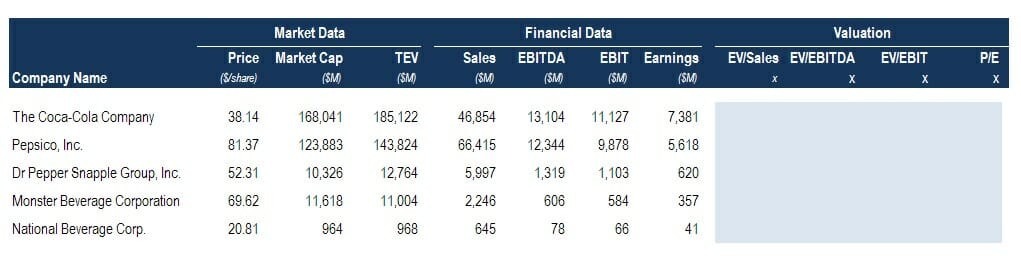 Financial Data
4. Calculating Valuation Multiples: A Comprehensive Guide
Valuation multiples are ratios that compare a company’s market value to a specific financial metric. These multiples are used to assess the relative valuation of a company and determine whether it is overvalued or undervalued compared to its peers.
4.1. Common Valuation Multiples
- Price-to-Earnings (P/E): Market capitalization divided by net income.
- Enterprise Value-to-EBITDA (EV/EBITDA): Enterprise value divided by earnings before interest, taxes, depreciation, and amortization.
- Price-to-Sales (P/S): Market capitalization divided by revenue.
- Price-to-Book (P/B): Market capitalization divided by book value of equity.
- Enterprise Value-to-Revenue (EV/Revenue): Enterprise value divided by revenue.
- Price-to-Cash Flow (P/CF): Market capitalization divided by cash flow from operations.
4.2. How to Calculate Valuation Multiples
To calculate valuation multiples, you need to gather the necessary financial data and apply the appropriate formula.
- P/E Ratio: Divide the company’s market capitalization by its net income. For example, if a company has a market capitalization of $500 million and net income of $50 million, its P/E ratio is 10x.
- EV/EBITDA Ratio: Divide the company’s enterprise value by its EBITDA. For example, if a company has an enterprise value of $800 million and EBITDA of $80 million, its EV/EBITDA ratio is 10x.
- P/S Ratio: Divide the company’s market capitalization by its revenue. For example, if a company has a market capitalization of $400 million and revenue of $200 million, its P/S ratio is 2x.
- P/B Ratio: Divide the company’s market capitalization by its book value of equity. For example, if a company has a market capitalization of $300 million and a book value of equity of $150 million, its P/B ratio is 2x.
- EV/Revenue Ratio: Divide the company’s enterprise value by its revenue. For example, if a company has an enterprise value of $600 million and revenue of $300 million, its EV/Revenue ratio is 2x.
- P/CF Ratio: Divide the company’s market capitalization by its cash flow from operations. For example, if a company has a market capitalization of $250 million and cash flow from operations of $25 million, its P/CF ratio is 10x.
4.3. Considerations When Calculating Multiples
- Use Consistent Time Periods: Use financial data from the same time period for all companies.
- Adjust for Non-Recurring Items: Exclude any non-recurring items that could distort the multiples.
- Use Forward-Looking Multiples: Consider using forward-looking multiples based on analysts’ earnings estimates.
- Normalize for Cyclicality: In cyclical industries, consider using average earnings over a business cycle.
4.4. Example of Calculating Valuation Multiples
Suppose you are calculating valuation multiples for a comparable company:
- Gather Financial Data: Collect the company’s market capitalization, enterprise value, revenue, EBITDA, net income, and book value of equity.
- Calculate P/E Ratio: Divide the market capitalization by net income.
- Calculate EV/EBITDA Ratio: Divide the enterprise value by EBITDA.
- Calculate P/S Ratio: Divide the market capitalization by revenue.
- Calculate P/B Ratio: Divide the market capitalization by the book value of equity.
5. Determining the Appropriate Multiple for Valuation
Once you have calculated valuation multiples for the comparable companies, the next step is to determine the appropriate multiple to use for valuing the target company.
5.1. Analyzing the Range of Multiples
- Identify the High and Low Multiples: Determine the highest and lowest multiples in the comparable company set.
- Calculate the Average Multiple: Calculate the average multiple by summing the multiples and dividing by the number of companies.
- Calculate the Median Multiple: Calculate the median multiple by finding the middle value in the sorted list of multiples.
5.2. Factors to Consider When Selecting a Multiple
- Industry Characteristics: Different industries tend to trade at different multiples.
- Growth Rate: Companies with higher growth rates typically trade at higher multiples.
- Profitability: Companies with higher profitability margins typically trade at higher multiples.
- Risk Profile: Companies with lower risk profiles typically trade at higher multiples.
- Market Conditions: Market conditions can influence multiples, so consider the current market environment.
5.3. Weighting the Multiples
In some cases, it may be appropriate to weight the multiples based on the relevance of each comparable company to the target company. For example, you might give more weight to companies that are more similar in terms of size, growth, and profitability.
5.4. Adjusting for Differences
If there are significant differences between the target company and the comparable companies, you may need to adjust the multiple to account for these differences. For example, if the target company has a higher growth rate than the comparable companies, you might apply a higher multiple.
5.5. Example of Determining the Appropriate Multiple
Suppose you have calculated the following EV/EBITDA multiples for a set of comparable companies: 8x, 9x, 10x, 11x, and 12x.
- Calculate the Range: The range of multiples is 8x to 12x.
- Calculate the Average: The average multiple is (8+9+10+11+12) / 5 = 10x.
- Calculate the Median: The median multiple is 10x.
- Consider Factors: After considering the factors listed above, you decide that the target company is slightly riskier than the comparable companies, so you choose a multiple slightly below the average, such as 9.5x.
6. Applying the Multiple to Estimate Value
Once you have determined the appropriate multiple, the final step is to apply the multiple to the relevant financial metric of the target company to estimate its value.
6.1. Choosing the Relevant Financial Metric
The choice of financial metric depends on the multiple being used. For example, if you are using the P/E ratio, you would apply the multiple to the target company’s earnings. If you are using the EV/EBITDA ratio, you would apply the multiple to the target company’s EBITDA.
6.2. Calculating the Implied Value
To calculate the implied value, multiply the chosen multiple by the relevant financial metric.
- Implied Equity Value: Multiple x Net Income
- Implied Enterprise Value: Multiple x EBITDA
6.3. Adjusting for Non-Operating Assets and Liabilities
After calculating the implied enterprise value, you may need to adjust for non-operating assets and liabilities to arrive at the implied equity value.
- Add Non-Operating Assets: Add the value of any non-operating assets, such as excess cash or investments.
- Subtract Non-Operating Liabilities: Subtract the value of any non-operating liabilities, such as debt or unfunded pension obligations.
6.4. Calculating the Implied Share Price
To calculate the implied share price, divide the implied equity value by the number of shares outstanding.
- Implied Share Price: Implied Equity Value / Shares Outstanding
6.5. Example of Applying the Multiple
Suppose you have determined that the appropriate EV/EBITDA multiple for a target company is 9.5x, and the company’s EBITDA is $50 million.
- Calculate Implied Enterprise Value: 9.5x * $50 million = $475 million.
- Adjust for Non-Operating Items: The company has $25 million in excess cash and $100 million in debt.
- Calculate Implied Equity Value: $475 million + $25 million – $100 million = $400 million.
- Calculate Implied Share Price: The company has 10 million shares outstanding, so the implied share price is $400 million / 10 million = $40 per share.
7. Interpreting the Results of Comparable Company Analysis
Interpreting the results of a comparable company analysis requires careful consideration of the various factors that can influence valuation multiples.
7.1. Understanding the Implied Valuation Range
The comparable company analysis provides an implied valuation range rather than a precise valuation. The range reflects the uncertainty inherent in the valuation process and the differences among the comparable companies.
7.2. Comparing the Implied Valuation to Market Value
Compare the implied valuation to the target company’s current market value to determine whether it is overvalued or undervalued.
- Overvalued: If the implied valuation is significantly below the market value, the company may be overvalued.
- Undervalued: If the implied valuation is significantly above the market value, the company may be undervalued.
- Fairly Valued: If the implied valuation is close to the market value, the company may be fairly valued.
7.3. Considering Qualitative Factors
Remember that the comparable company analysis only considers quantitative factors. It is essential to also consider qualitative factors, such as management quality, brand reputation, and competitive advantages.
7.4. Sensitivity Analysis
Perform a sensitivity analysis to assess how the implied valuation changes under different assumptions. For example, you might vary the multiple or the financial metric to see how the implied valuation is affected.
7.5. Using the Results in Decision-Making
The results of the comparable company analysis can be used to inform a variety of decisions, such as:
- Investment Decisions: Determine whether to buy, sell, or hold a stock.
- M&A Transactions: Assess the fairness of a proposed merger or acquisition.
- Capital Raising: Determine the appropriate pricing for a new stock offering.
- Corporate Strategy: Evaluate the company’s strategic options and identify potential areas for improvement.
7.6. Example of Interpreting the Results
Suppose you have performed a comparable company analysis and found that the implied share price for a target company is $40 per share, while the current market price is $30 per share.
- Compare to Market Value: The implied share price is significantly above the market price, suggesting that the company may be undervalued.
- Consider Qualitative Factors: After considering qualitative factors, you conclude that the company has strong management and a solid competitive position.
- Sensitivity Analysis: A sensitivity analysis shows that the implied share price remains above the market price even under conservative assumptions.
- Decision-Making: Based on the analysis, you decide to recommend buying the stock, as it appears to be undervalued.
8. Advanced Considerations in Comparable Company Analysis
While the basic steps of comparable company analysis are straightforward, there are several advanced considerations that can improve the accuracy and reliability of the valuation.
8.1. Dealing with Non-Comparable Companies
In some cases, it may be challenging to find companies that are perfectly comparable to the target company. In these situations, you may need to make adjustments to the multiples or consider using a broader set of comparable companies.
8.2. Using Regression Analysis
Regression analysis can be used to identify the factors that most influence valuation multiples and to develop a more precise valuation model.
8.3. Incorporating Transaction Multiples
In addition to using trading multiples based on current market prices, you can also consider using transaction multiples based on the prices paid in recent M&A transactions.
8.4. Addressing Cyclicality
In cyclical industries, it is important to address the impact of cyclicality on valuation multiples. This can be done by using average earnings over a business cycle or by normalizing the financial data.
8.5. Considering Private Companies
While the comparable company analysis typically focuses on publicly traded companies, it is sometimes possible to use data from private companies as well. This can be done by adjusting the multiples to account for the differences between public and private companies.
8.6. Staying Up-to-Date
The financial markets are constantly changing, so it is essential to stay up-to-date on the latest developments and to regularly review and update your comparable company analysis.
9. Real-World Applications of Comparable Company Analysis
The comparable company analysis is widely used in the financial industry for a variety of purposes.
9.1. Investment Banking
Investment bankers use the comparable company analysis to advise companies on M&A transactions, capital raising, and other strategic decisions.
9.2. Equity Research
Equity research analysts use the comparable company analysis to evaluate the investment potential of stocks and to make buy, sell, or hold recommendations.
9.3. Private Equity
Private equity firms use the comparable company analysis to value potential investment targets and to determine the appropriate purchase price.
9.4. Corporate Finance
Corporate finance professionals use the comparable company analysis to evaluate investment opportunities, to assess the fairness of M&A transactions, and to make capital budgeting decisions.
9.5. Valuation Firms
Valuation firms specialize in providing independent valuations for a variety of purposes, including financial reporting, tax compliance, and litigation support.
10. COMPARE.EDU.VN: Your Partner in Mastering Comparable Company Analysis
COMPARE.EDU.VN provides comprehensive resources and tools to help you master the comparable company approach.
10.1. Detailed Comparisons and Analyses
Our website offers detailed comparisons and analyses of various companies, industries, and valuation multiples.
10.2. Step-by-Step Guides
We provide step-by-step guides and tutorials on how to perform comparable company analysis.
10.3. Templates and Tools
Downloadable templates and tools simplify the valuation process.
10.4. Expert Insights
Benefit from expert insights and analysis from industry professionals.
10.5. Real-World Examples
Explore real-world examples of how the comparable company approach is used in practice.
By leveraging the resources and tools available on COMPARE.EDU.VN, you can enhance your understanding of the comparable company approach and improve your valuation skills.
FAQ: Frequently Asked Questions About Comparable Company Analysis
1. What is the comparable company approach?
The comparable company approach is a valuation method that values a company by comparing it to its peers.
2. How do I identify comparable companies?
Identify comparable companies by looking for companies that operate in the same industry, have similar business models, and face similar risks and opportunities.
3. What are the key valuation multiples used in the comparable company approach?
Key valuation multiples include P/E, EV/EBITDA, P/S, and P/B ratios.
4. How do I calculate valuation multiples?
Calculate valuation multiples by dividing a company’s market value by a specific financial metric.
5. How do I determine the appropriate multiple to use for valuation?
Determine the appropriate multiple by analyzing the range of multiples observed in the comparable companies and considering factors such as industry characteristics, growth rate, and risk profile.
6. How do I apply the multiple to estimate value?
Apply the multiple to the relevant financial metric of the target company to estimate its value.
7. How do I interpret the results of the comparable company analysis?
Interpret the results by comparing the implied valuation to the target company’s current market value and considering qualitative factors.
8. What are the limitations of the comparable company approach?
Limitations include the difficulty of finding truly comparable companies, the impact of market distortions, and the failure to capture company-specific factors.
9. How can I improve the accuracy of the comparable company analysis?
Improve accuracy by using consistent data, adjusting for non-recurring items, and considering forward-looking multiples.
10. Where can I find more information about the comparable company approach?
Visit COMPARE.EDU.VN for detailed guides, templates, and expert insights on the comparable company approach.
In conclusion, the comparable company approach is a valuable tool for assessing a company’s value by comparing it to its peers. This method uses financial metrics and valuation multiples to benchmark performance, identify investment opportunities, and make informed business decisions. Remember to use the resources at COMPARE.EDU.VN to refine your analysis and ensure well-informed decision-making.
For more information and expert guidance on comparable company analysis, contact us today:
Address: 333 Comparison Plaza, Choice City, CA 90210, United States
WhatsApp: +1 (626) 555-9090
Website: COMPARE.EDU.VN
Take advantage of compare.edu.vn to make insightful comparisons and make sound decisions in your financial endeavors.