Horizontal analysis compares financial data across different time periods to identify trends and growth patterns. COMPARE.EDU.VN offers detailed comparisons to help you understand these trends and make informed decisions. This detailed guide explores the essentials of horizontal analysis, its key metrics, applications, and limitations, empowering you with the knowledge to analyze financial performance effectively and using trending analysis and comparative financial statements techniques.
1. What Is Horizontal Analysis?
Horizontal analysis, also known as trend analysis, is a method used to evaluate financial statements by comparing specific financial data over different accounting periods. It examines historical trends to identify patterns of growth or decline. This approach helps analysts and investors understand a company’s financial performance over time. By comparing data from different periods, horizontal analysis reveals significant changes and trends that might not be apparent from looking at a single period’s data. This makes it a valuable tool for assessing a company’s financial health and predicting future performance.
2. How Does Horizontal Analysis Work?
The core principle of horizontal analysis involves comparing financial statement line items across multiple periods. The process typically involves the following steps:
- Selecting a Base Year: Choose a base year as a reference point.
- Calculating Changes: Determine the dollar and percentage changes between the base year and subsequent years.
- Analyzing Trends: Evaluate the significance of these changes to identify meaningful trends.
2.1 What Are The Key Components Of Horizontal Analysis?
Horizontal analysis is underpinned by several key components that allow for a thorough evaluation of financial performance over time. These components include:
- Base Year Selection: The selection of a base year is crucial in horizontal analysis. This year serves as the benchmark against which all subsequent years are compared. The choice of the base year can significantly impact the analysis, as it sets the foundation for identifying trends and changes in financial performance. Analysts often choose a stable year that is representative of the company’s normal operations to avoid distortions caused by unusual events or economic conditions.
- Comparative Financial Statements: These statements are essential for horizontal analysis as they present financial data from multiple periods side-by-side. Comparative balance sheets, income statements, and cash flow statements allow for easy comparison of line items such as revenues, expenses, assets, and liabilities. This side-by-side comparison facilitates the identification of changes and trends over time, providing a clear picture of the company’s financial trajectory.
- Calculation of Changes (Dollar and Percentage): This involves determining the absolute and relative changes in financial statement line items between the base year and subsequent years. The dollar change represents the actual monetary increase or decrease, while the percentage change expresses this change as a proportion of the base year value.
- Dollar Change: Calculated by subtracting the base year value from the subsequent year value, the dollar change indicates the magnitude of the change in absolute terms.
- Percentage Change: Calculated by dividing the dollar change by the base year value and multiplying by 100, the percentage change provides a relative measure of the change. It allows for easy comparison of changes across different line items and periods, regardless of their absolute values.
- Trend Identification: Identifying trends is the primary goal of horizontal analysis. Trends can be positive (growth), negative (decline), or stable. Analysts look for patterns and consistencies in the changes over time to understand the underlying drivers of financial performance. For example, a consistent increase in revenue may indicate successful marketing strategies, while a steady decline in profit margins may signal operational inefficiencies.
- Analysis and Interpretation: The analysis and interpretation of trends are crucial for drawing meaningful conclusions from the data. Analysts consider the context of the company, its industry, and the overall economic environment to understand the factors influencing the trends. This involves examining the reasons behind the changes and assessing their potential impact on the company’s future performance.
- Benchmarking: Benchmarking is the process of comparing a company’s financial performance against that of its competitors or industry averages. This helps to provide context for the trends identified through horizontal analysis. By comparing the company’s growth rates, profitability, and efficiency ratios with those of its peers, analysts can assess its relative performance and identify areas where it may be lagging or excelling.
- Graphical Representation: Presenting horizontal analysis data in a graphical format can enhance understanding and communication. Line graphs, bar charts, and other visual aids can effectively illustrate trends and changes over time, making it easier for stakeholders to grasp the key insights.
- Variance Analysis: Variance analysis involves investigating the reasons for significant deviations from expected or budgeted values. This helps to identify the underlying causes of unexpected changes in financial performance. By understanding the factors driving variances, managers can take corrective actions to improve performance.
- Forecasting: The historical trends identified through horizontal analysis can be used to forecast future financial performance. By extrapolating past trends into the future, analysts can develop projections for revenues, expenses, and other key financial metrics. However, it’s important to recognize that forecasts are based on assumptions and may not always accurately predict future outcomes.
- Qualitative Factors: While horizontal analysis primarily focuses on quantitative data, it’s important to consider qualitative factors as well. These include changes in management, regulatory developments, competitive landscape, and technological innovations. Qualitative factors can provide valuable context for understanding the trends identified through horizontal analysis.
2.2 What Are The Formulas Used In Horizontal Analysis?
The formulas used in horizontal analysis are straightforward but powerful in revealing financial trends. Here are the primary formulas:
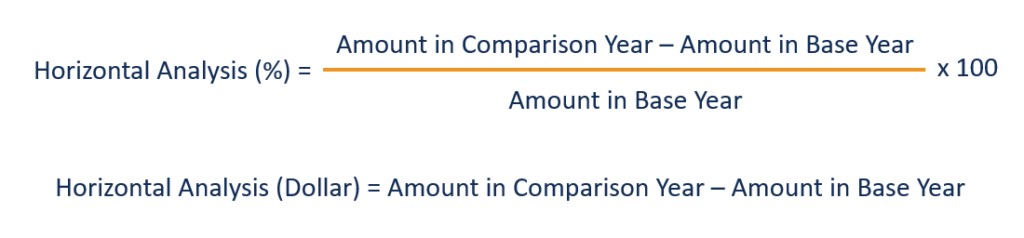
-
Dollar Change:
Dollar Change = Current Period Value - Base Period ValueThis formula calculates the absolute change in a financial statement item between two periods.
-
Percentage Change:
Percentage Change = ((Current Period Value - Base Period Value) / Base Period Value) * 100This formula expresses the change as a percentage of the base period value, providing a relative measure of growth or decline.
 Horizontal Analysis Formulas
3. What Financial Statements Are Used In Horizontal Analysis?
Horizontal analysis can be applied to various financial statements to gain a comprehensive understanding of a company’s performance. The primary statements include:
- Income Statement: Analyzes revenue, cost of goods sold, and operating expenses to identify trends in profitability.
- Balance Sheet: Examines assets, liabilities, and equity to assess changes in a company’s financial position.
- Statement of Cash Flows: Evaluates cash inflows and outflows to understand how a company generates and uses cash.
3.1 How To Apply Horizontal Analysis To The Income Statement?
Applying horizontal analysis to the income statement involves comparing key line items such as revenue, cost of goods sold, gross profit, operating expenses, and net income across different periods. This allows for the identification of trends in profitability and operational efficiency.
- Revenue Analysis: Comparing revenue figures over time can reveal whether the company is growing its sales, experiencing a decline, or maintaining a stable revenue stream. An increasing revenue trend is generally positive, indicating that the company’s products or services are in demand. However, it’s important to consider the reasons behind the increase, such as increased sales volume, higher prices, or new product launches.
- Cost of Goods Sold (COGS) Analysis: Analyzing COGS in conjunction with revenue can provide insights into the company’s production efficiency. A decreasing COGS as a percentage of revenue may indicate improved cost management or economies of scale. Conversely, an increasing COGS may signal rising input costs or production inefficiencies.
- Gross Profit Analysis: Gross profit, which is revenue less COGS, is a key indicator of profitability. Analyzing gross profit trends can reveal whether the company is effectively managing its production costs and pricing strategies. An increasing gross profit margin (gross profit as a percentage of revenue) is generally favorable, while a decreasing margin may warrant further investigation.
- Operating Expenses Analysis: Operating expenses, such as selling, general, and administrative expenses, are the costs incurred in running the business. Analyzing operating expenses can help identify areas where the company may be improving or becoming less efficient. A decreasing trend in operating expenses as a percentage of revenue may indicate better cost control, while an increasing trend may signal rising overhead costs or investments in growth initiatives.
- Net Income Analysis: Net income, the bottom line of the income statement, represents the company’s profit after all expenses and taxes. Analyzing net income trends provides an overall assessment of the company’s profitability. An increasing net income trend is generally positive, indicating that the company is generating more profit over time. However, it’s important to consider the factors driving the increase, such as revenue growth, cost reductions, or changes in tax rates.
- Ratio Analysis: In addition to analyzing individual line items, it’s also useful to calculate and analyze key profitability ratios, such as the gross profit margin, operating profit margin, and net profit margin. These ratios provide a standardized measure of profitability that can be compared across different periods and against industry benchmarks.
3.2 How To Apply Horizontal Analysis To The Balance Sheet?
Horizontal analysis of the balance sheet involves comparing key asset, liability, and equity accounts over time. This helps to assess changes in a company’s financial position, liquidity, and solvency.
- Asset Analysis:
- Current Assets: Analyzing current assets, such as cash, accounts receivable, and inventory, can provide insights into a company’s liquidity and working capital management. An increasing trend in current assets may indicate improved liquidity, while a decreasing trend may signal potential cash flow problems.
- Non-Current Assets: Analyzing non-current assets, such as property, plant, and equipment (PP&E), and intangible assets, can reveal investments in long-term growth. An increasing trend in PP&E may indicate expansion or modernization of operations, while changes in intangible assets may reflect acquisitions or impairments.
- Liability Analysis:
- Current Liabilities: Analyzing current liabilities, such as accounts payable, short-term debt, and accrued expenses, can provide insights into a company’s short-term obligations. An increasing trend in current liabilities may indicate greater reliance on short-term financing, while a decreasing trend may signal improved liquidity.
- Non-Current Liabilities: Analyzing non-current liabilities, such as long-term debt and deferred tax liabilities, can reveal a company’s long-term financing structure. An increasing trend in long-term debt may indicate greater leverage, while changes in deferred tax liabilities may reflect changes in tax laws or accounting methods.
- Equity Analysis:
- Shareholders’ Equity: Analyzing shareholders’ equity, including common stock, retained earnings, and additional paid-in capital, can provide insights into a company’s ownership structure and financial strength. An increasing trend in retained earnings may indicate profitable operations, while changes in common stock or additional paid-in capital may reflect stock issuances or repurchases.
- Ratio Analysis: In addition to analyzing individual accounts, it’s also useful to calculate and analyze key financial ratios, such as the current ratio, quick ratio, debt-to-equity ratio, and asset turnover ratio. These ratios provide a standardized measure of a company’s financial position that can be compared across different periods and against industry benchmarks.
3.3 How To Apply Horizontal Analysis To The Statement Of Cash Flows?
Applying horizontal analysis to the statement of cash flows involves examining trends in cash inflows and outflows from operating, investing, and financing activities. This helps to understand how a company generates and uses cash.
- Cash Flow from Operating Activities: Analyzing cash flow from operating activities can reveal the company’s ability to generate cash from its core business operations. An increasing trend in cash flow from operations is generally positive, indicating that the company is effectively managing its working capital and generating sufficient cash to cover its operating expenses.
- Cash Flow from Investing Activities: Analyzing cash flow from investing activities can provide insights into the company’s investments in long-term assets, such as property, plant, and equipment (PP&E), and acquisitions of other businesses. A decreasing trend in cash outflows for investing activities may indicate reduced capital expenditures or a slowdown in expansion plans.
- Cash Flow from Financing Activities: Analyzing cash flow from financing activities can reveal the company’s financing structure and its use of debt and equity. An increasing trend in cash inflows from financing activities may indicate greater reliance on debt or equity financing, while an increasing trend in cash outflows for financing activities may signal debt repayment or stock repurchases.
- Net Change in Cash: The net change in cash, which is the sum of cash flow from operating, investing, and financing activities, represents the overall increase or decrease in the company’s cash balance. Analyzing the net change in cash can provide a high-level assessment of the company’s cash flow performance.
- Free Cash Flow: Free cash flow, which is cash flow from operating activities less capital expenditures, is a key indicator of a company’s financial flexibility. Analyzing free cash flow trends can reveal the company’s ability to generate cash for discretionary purposes, such as paying dividends, repurchasing stock, or making acquisitions.
4. What Are The Benefits Of Horizontal Analysis?
Horizontal analysis offers several advantages in financial analysis:
- Trend Identification: Reveals patterns of growth or decline.
- Performance Evaluation: Assesses a company’s financial health over time.
- Forecasting: Provides insights for future financial projections.
- Comparative Analysis: Facilitates comparison with competitors and industry benchmarks.
- Early Warning Signals: It can detect potential financial problems early, such as declining revenue or increasing expenses.
- Strategic Planning: Supports better decision-making and strategic planning by providing a clear understanding of financial trends.
- Investment Decisions: Helps investors make informed investment decisions by assessing a company’s long-term financial performance.
- Operational Efficiency: Identifies areas of operational inefficiency, such as rising costs or declining profit margins.
- Performance Benchmarking: Allows companies to benchmark their performance against competitors and industry averages.
- Risk Assessment: Aids in risk assessment by highlighting potential financial vulnerabilities.
- Improved Communication: Presents financial data in a clear and understandable format, facilitating better communication among stakeholders.
- Resource Allocation: Supports better resource allocation by identifying areas where resources can be used more effectively.
- Cost Control: Helps in identifying and controlling costs by highlighting areas where expenses are increasing.
- Revenue Growth: Assists in understanding and managing revenue growth by analyzing trends in sales and pricing.
- Profitability Analysis: Provides a comprehensive view of profitability by analyzing trends in revenue, expenses, and net income.
- Financial Health Assessment: Gives an overall assessment of a company’s financial health, including liquidity, solvency, and profitability.
- Decision Support: Supports informed decision-making at all levels of the organization.
- Stakeholder Confidence: Enhances stakeholder confidence by demonstrating transparency and accountability in financial reporting.
- Compliance: Helps ensure compliance with financial reporting standards and regulations.
5. What Are The Limitations Of Horizontal Analysis?
Despite its usefulness, horizontal analysis has certain limitations:
- Choice of Base Year: Results can vary significantly depending on the base year chosen.
- Accounting Changes: Changes in accounting methods can distort comparisons.
- Inflation: It does not account for inflation, which can skew results over long periods.
- One-Off Events: Unusual or non-recurring events can distort trends.
- Lack of Context: It may not provide sufficient context without additional qualitative analysis.
- Limited Scope: Focuses primarily on historical data and may not accurately predict future performance.
- Industry-Specific Factors: Does not always account for industry-specific factors that can impact financial performance.
- Economic Conditions: Can be influenced by broader economic conditions, such as recessions or booms.
- Competitive Landscape: May not fully capture the impact of changes in the competitive landscape.
- Qualitative Factors: Ignores qualitative factors, such as changes in management or brand reputation.
- Accounting Policies: Can be affected by changes in accounting policies or estimates.
- Data Comparability: Assumes that financial data is comparable across periods, which may not always be the case.
- Simplistic View: Provides a simplistic view of financial performance that may not capture the complexity of the business.
- Potential for Manipulation: Financial data can be manipulated to present a more favorable picture.
- Limited Predictive Power: May not be a reliable predictor of future financial performance due to changing circumstances.
- Lack of Causation: Can identify trends but does not necessarily establish causation.
- External Factors: Ignores external factors, such as regulatory changes or technological disruptions.
- Subjectivity: Interpretation of trends can be subjective and influenced by personal biases.
- Time-Consuming: Can be time-consuming to perform, especially for large and complex companies.
- Static Analysis: Provides a static view of financial performance that does not capture the dynamic nature of the business.
6. What Is The Difference Between Horizontal And Vertical Analysis?
Horizontal and vertical analysis are two distinct methods for analyzing financial statements. Horizontal analysis compares financial data across different time periods, while vertical analysis examines the proportional relationship of items within a single financial statement.
| Feature | Horizontal Analysis | Vertical Analysis |
|---|---|---|
| Purpose | Identify trends and changes over time | Analyze the proportional relationship within a statement |
| Comparison | Across different periods | Within a single period |
| Statements Used | Income statement, balance sheet, cash flow statement | Income statement, balance sheet |
| Calculation | Percentage change from a base year | Percentage of a base figure (e.g., total assets) |
| Focus | Trend analysis and growth patterns | Composition and structure of financial statements |
| Example | Comparing revenue growth over five years | Analyzing cost of goods sold as a percentage of revenue |
7. When Should You Use Horizontal Analysis?
Horizontal analysis is most useful when:
- Evaluating Long-Term Performance: Assessing a company’s financial health over several years.
- Identifying Growth Trends: Spotting patterns of growth or decline in key financial metrics.
- Supporting Investment Decisions: Making informed decisions about investing in a company.
- Strategic Planning: Developing long-term strategic plans based on financial trends.
- Detecting Financial Problems: Identifying potential financial problems early on.
- Comparative Assessments: Comparing a company’s performance against its competitors.
- Forecasting Future Performance: Predicting future financial performance based on historical trends.
- Performance Monitoring: Monitoring a company’s performance against its own historical benchmarks.
- Budgeting and Forecasting: Developing budgets and forecasts based on historical trends.
- Risk Management: Assessing financial risks and vulnerabilities.
- Operational Analysis: Identifying areas of operational efficiency or inefficiency.
- Cost Management: Monitoring and controlling costs by analyzing expense trends.
- Revenue Analysis: Understanding and managing revenue growth by analyzing sales trends.
- Profitability Analysis: Analyzing trends in profitability to improve financial performance.
- Financial Reporting: Presenting financial data in a clear and understandable format.
- Stakeholder Communication: Communicating financial performance to stakeholders, such as investors and creditors.
- Investment Analysis: Evaluating investment opportunities based on financial trends.
- Mergers and Acquisitions: Assessing the financial health of potential merger or acquisition targets.
- Credit Analysis: Evaluating the creditworthiness of borrowers.
- Compliance: Ensuring compliance with financial reporting standards and regulations.
8. Horizontal Analysis Example
Consider Company XYZ, which reported the following revenue figures over three years:
| Year | Revenue (USD) |
|---|---|
| 2022 | 1,000,000 |
| 2023 | 1,200,000 |
| 2024 | 1,350,000 |
Using 2022 as the base year, the horizontal analysis would be:
| Year | Revenue (USD) | Dollar Change from 2022 | Percentage Change from 2022 |
|---|---|---|---|
| 2022 | 1,000,000 | – | – |
| 2023 | 1,200,000 | 200,000 | 20% |
| 2024 | 1,350,000 | 350,000 | 35% |
This analysis shows that Company XYZ experienced a 20% revenue increase in 2023 and a 35% increase in 2024 compared to 2022.
9. Horizontal Analysis: A Step-By-Step Guide
- Step 1: Gather Financial Statements for the periods you want to compare.
- Step 2: Select a Base Year that will be your point of reference.
- Step 3: Calculate the Dollar Change: Subtract the Base Year value from each subsequent year’s value for each line item.
- Step 4: Calculate the Percentage Change: Divide the Dollar Change by the Base Year value and multiply by 100.
- Step 5: Analyze the Trends: Look for patterns in the changes over time. Are there consistent increases or decreases? What do these trends suggest about the company’s performance?
- Step 6: Interpret the Results: Consider the context of the company, its industry, and the overall economic environment to understand the factors influencing the trends.
- Step 7: Document Your Findings: Prepare a report or presentation summarizing your analysis and its implications.
10. Horizontal Analysis Best Practices
To ensure the accuracy and effectiveness of horizontal analysis, consider the following best practices:
- Choose a Representative Base Year: Select a year that reflects normal operating conditions to avoid distortions caused by unusual events.
- Use Consistent Accounting Methods: Ensure that the company has used consistent accounting methods over the periods being compared.
- Adjust for Inflation: If comparing data over long periods, adjust for inflation to provide a more accurate picture of real growth.
- Consider Qualitative Factors: Supplement the quantitative analysis with qualitative factors, such as changes in management or competitive conditions.
- Benchmark Against Competitors: Compare the company’s performance against its competitors to assess its relative position in the industry.
- Focus on Key Performance Indicators (KPIs): Focus on the most important financial metrics that drive the company’s performance.
- Document Assumptions: Clearly document any assumptions made during the analysis.
- Use Visual Aids: Use charts and graphs to illustrate trends and make the analysis more accessible.
- Regularly Update the Analysis: Update the analysis regularly to track changes in financial performance over time.
- Seek Expert Advice: Consult with financial experts or analysts to gain additional insights and perspectives.
11. FAQ: Horizontal Analysis
-
Q: What is the main purpose of horizontal analysis?
- A: The primary purpose is to identify trends and changes in financial data over time, helping to evaluate a company’s performance and predict future outcomes.
-
Q: How do you choose the base year in horizontal analysis?
- A: Select a year that represents normal operating conditions, avoiding years with unusual events or economic distortions.
-
Q: Can horizontal analysis be used for any financial statement?
- A: Yes, it can be applied to the income statement, balance sheet, and statement of cash flows.
-
Q: What are the key limitations of horizontal analysis?
- A: Limitations include the choice of base year, changes in accounting methods, and the inability to account for inflation and one-off events.
-
Q: How does horizontal analysis help in forecasting?
- A: By identifying historical trends, horizontal analysis provides insights that can be used to project future financial performance.
-
Q: What is the formula for calculating percentage change in horizontal analysis?
- A: The formula is: ((Current Period Value – Base Period Value) / Base Period Value) * 100.
-
Q: How does horizontal analysis differ from vertical analysis?
- A: Horizontal analysis compares data across different time periods, while vertical analysis examines the proportional relationship of items within a single financial statement.
-
Q: What is the significance of dollar change in horizontal analysis?
- A: Dollar change indicates the absolute change in a financial statement item between two periods, providing a measure of the magnitude of the change.
-
Q: Why is it important to consider qualitative factors in horizontal analysis?
- A: Qualitative factors provide context for understanding the trends identified through quantitative analysis, such as changes in management or competitive conditions.
-
Q: How can horizontal analysis help in identifying potential financial problems?
- A: By highlighting trends such as declining revenue, increasing expenses, or decreasing cash flow, horizontal analysis can signal potential financial problems early on.
12. Conclusion: Unleash The Power Of Horizontal Analysis
Horizontal analysis is a powerful tool for evaluating financial performance and identifying trends. By comparing financial data across different periods, analysts and investors can gain valuable insights into a company’s financial health and future prospects. At COMPARE.EDU.VN, we provide detailed comparisons and analyses to help you make informed decisions.
Ready to take control of your financial analysis? Visit COMPARE.EDU.VN today to explore our comprehensive resources and tools. Whether you’re comparing investment opportunities or assessing your company’s performance, we’re here to help you make informed decisions. Contact us at 333 Comparison Plaza, Choice City, CA 90210, United States, or reach out via WhatsApp at +1 (626) 555-9090. Let compare.edu.vn be your trusted partner in financial analysis and decision-making.