For investors seeking opportunities beyond the mega-cap stocks that dominated market gains in 2023, the iShares Russell 2000 ETF (NYSEARCA:IWM) presents a compelling case. This exchange-traded fund provides exposure to nearly 2,000 small-cap companies, a segment of the market that has notably lagged behind the broader rally. This analysis explores why IWM could be a strategic addition to portfolios, focusing on its catch-up potential, attractive valuation, and diversification benefits, especially when compared to other key market indices and ETFs.
Understanding the Russell 2000 Index
To fully grasp the significance of IWM, it’s crucial to understand its underlying index, the Russell 2000. Unlike the S&P 500 (SPX), which tracks the 500 largest U.S. companies, and the Russell 1000, comprising the next 1,000 largest, the Russell 2000 focuses on the smaller end of the market spectrum. It includes the roughly 2,000 smallest companies within the Russell 3000 index, which is designed to represent the entire U.S. stock market. The Russell 2000 is widely recognized as the benchmark for small-cap stock performance.
While there isn’t a rigid definition of “small-cap,” the holdings within IWM generally consist of companies with market capitalizations ranging from approximately $6 to $7 billion. A notable exception, due to extraordinary growth, is Super Micro Computer (NASDAQ:SMCI), which, despite its larger $15 billion market cap, remains a top holding reflecting the dynamic nature of the index.
The Opportunity: IWM’s Catch-Up Potential
The market’s gains in the current year have been largely driven by a select group of mega-cap technology stocks. The S&P 500 has risen by around 14.5% year-to-date, while the Nasdaq (NDX) has surged by over 30%. Individual tech giants like Nvidia (NASDAQ:NVDA), Meta Platforms (NASDAQ:META), and Tesla (NASDAQ:TSLA) have seen even more dramatic increases, leading some investors to believe that these sectors might be overextended.
This scenario creates an opportune moment for small-cap stocks and, consequently, for NYSEARCA:IWM. In stark contrast to the tech-heavy indices, IWM has remained relatively flat year-to-date. It has significantly underperformed not only the Russell 1000 ETFs like the iShares Russell 1000 ETF (NYSEARCA:IWB) and S&P 500 ETFs such as the SPDR S&P 500 ETF Trust (NYSEARCA:SPY), but also Nasdaq-centric ETFs like the Invesco QQQ Trust (NASDAQ:QQQ). This underperformance, by almost 15% compared to broad market ETFs and nearly 40% compared to Nasdaq ETFs, positions IWM for a potential catch-up rally as investors look for value and diversification beyond the leading sectors.
Valuation Advantage: IWM Compared to Larger Indices
Beyond the catch-up narrative, NYSEARCA:IWM offers a compelling valuation proposition. While concerns about inflated valuations circulate regarding market leaders, the small-cap stocks within IWM are collectively trading at attractive levels. The average price-to-earnings (P/E) ratio for IWM is approximately 10.4. This is significantly lower than the Russell 1000 index (IWB) with a P/E ratio of 21.4, and also more appealing than the S&P 500 and Nasdaq 100. This valuation discount makes IWM a potentially undervalued investment compared to broader market benchmarks.
Moreover, in an economic climate where recession concerns persist, IWM’s defensive characteristics become even more relevant. Historically, small-cap stocks have demonstrated resilience during and after economic downturns. A Wall Street Journal report indicated that small-caps have outperformed large-caps in 11 out of the last 12 recessions within the 12 months following the recession’s declaration, by an average of 16.5 percentage points. This historical trend suggests that IWM compare favorably as a strategic holding to navigate potential economic uncertainties and capitalize on recovery phases.
Diversification and Holdings of NYSEARCA:IWM
A key advantage of NYSEARCA:IWM is its exceptional diversification. Holding nearly 2,000 stocks, IWM effectively mitigates concentration risk. The ETF’s top 10 holdings constitute a mere 3.45% of its total assets.
This level of diversification significantly surpasses that of S&P 500 or Russell 1000 ETFs. For instance, SPY holds around 505 stocks, with its top 10 holdings representing a substantial 31.5% of the fund. Similarly, IWB, while holding over 1,000 stocks, still has 28.9% of its assets concentrated in its top 10.
The table below outlines IWM’s top 10 holdings, illustrating the breadth of companies within the ETF.
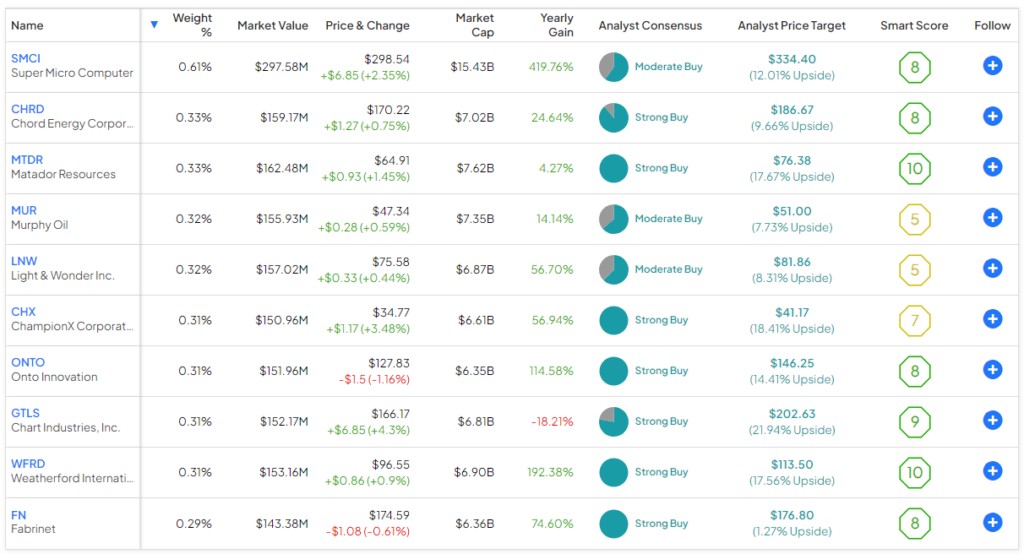 IWM ETF Top 10 Holdings Comparison: A table showing the top ten investments within the iShares Russell 2000 ETF (NYSEARCA:IWM), highlighting key stock information and portfolio diversification.
Despite being smaller companies, these holdings are still subject to rigorous analysis. TipRanks’ Smart Score system, a quantitative tool evaluating stocks based on eight key market factors, reflects positively on IWM’s top holdings. A significant majority, seven out of the top 10, have a Smart Score of 8 or higher, indicating an “Outperform” rating. Notably, Weatherford International (NASDAQ:WFRD) and Matador Resources (NYSE:MTDR) boast a “Perfect 10” Smart Score.
IWM’s diversification extends beyond individual stocks to sector allocation. While it includes energy sector companies, its sector weightings are distributed across industrials (17.4%), financials (16.4%), health care (14.1%), information technology (13.6%), and consumer discretionary (10.5%). Energy, despite the presence of some energy companies in top holdings, accounts for just 8.5% of the fund, demonstrating balanced sector exposure.
Analyst Ratings and IWM Stock Forecast
Wall Street analysts hold a generally positive outlook on the stocks within IWM. The ETF has a Moderate Buy consensus rating, based on a substantial number of Buy recommendations (1,279 Buys) compared to Hold (637) and Sell (67) ratings over the past three months. The average IWM stock price target is $230.49, suggesting a potential upside of over 30%. This analyst outlook further strengthens the investment case for NYSEARCA:IWM.
Expense Ratio of IWM
IWM maintains a reasonable expense ratio of 0.19%. For a $10,000 investment, this translates to approximately $19 in annual fees. Even with a hypothetical 5% annual growth and a consistent expense ratio, the total fees over a 10-year period would be a modest $243. This cost-effectiveness enhances IWM’s appeal as a long-term investment vehicle.
Conclusion: Is IWM a Smart Investment?
NYSEARCA:IWM emerges as a compelling contrarian investment choice. Its underperformance relative to major indices in the current year, coupled with a significantly cheaper valuation, positions it for potential catch-up gains. Historically, small-cap stocks have led market recoveries post-recession, suggesting IWM could be well-placed for future economic cycles. Combined with its extensive diversification and a low expense ratio, IWM offers a strategic and cost-effective way for investors to access the small-cap segment and diversify their portfolios beyond the current market leaders. For investors looking to compare investment options and seeking growth potential outside of mega-cap stocks, NYSEARCA:IWM warrants serious consideration.
Disclosure